
Explore · SVG gallery
SVG Template Gallery
Every chart template in the vfairness rendering module: 44 templates, shown as 49 example cards. Select any card for a full preview and the code that renders it.
How the 44 are counted
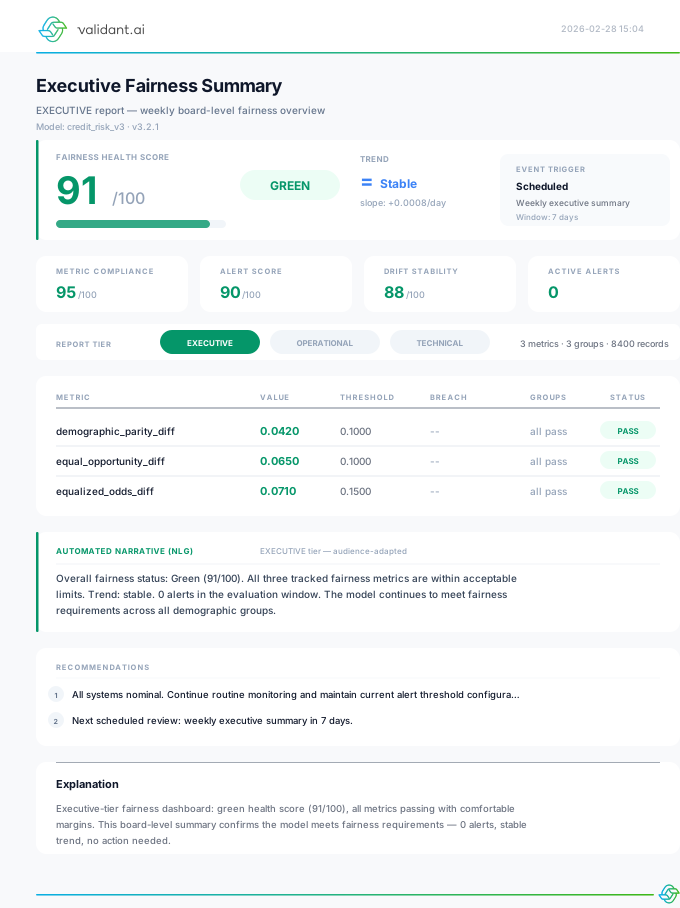
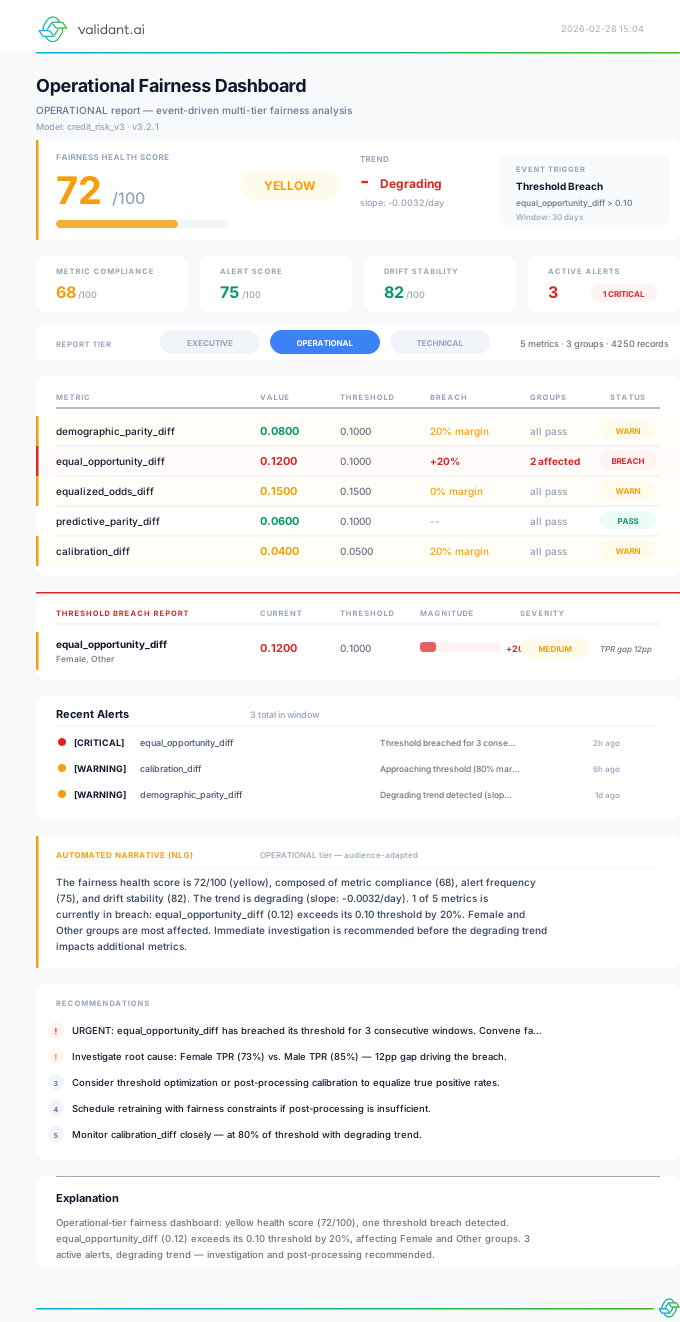
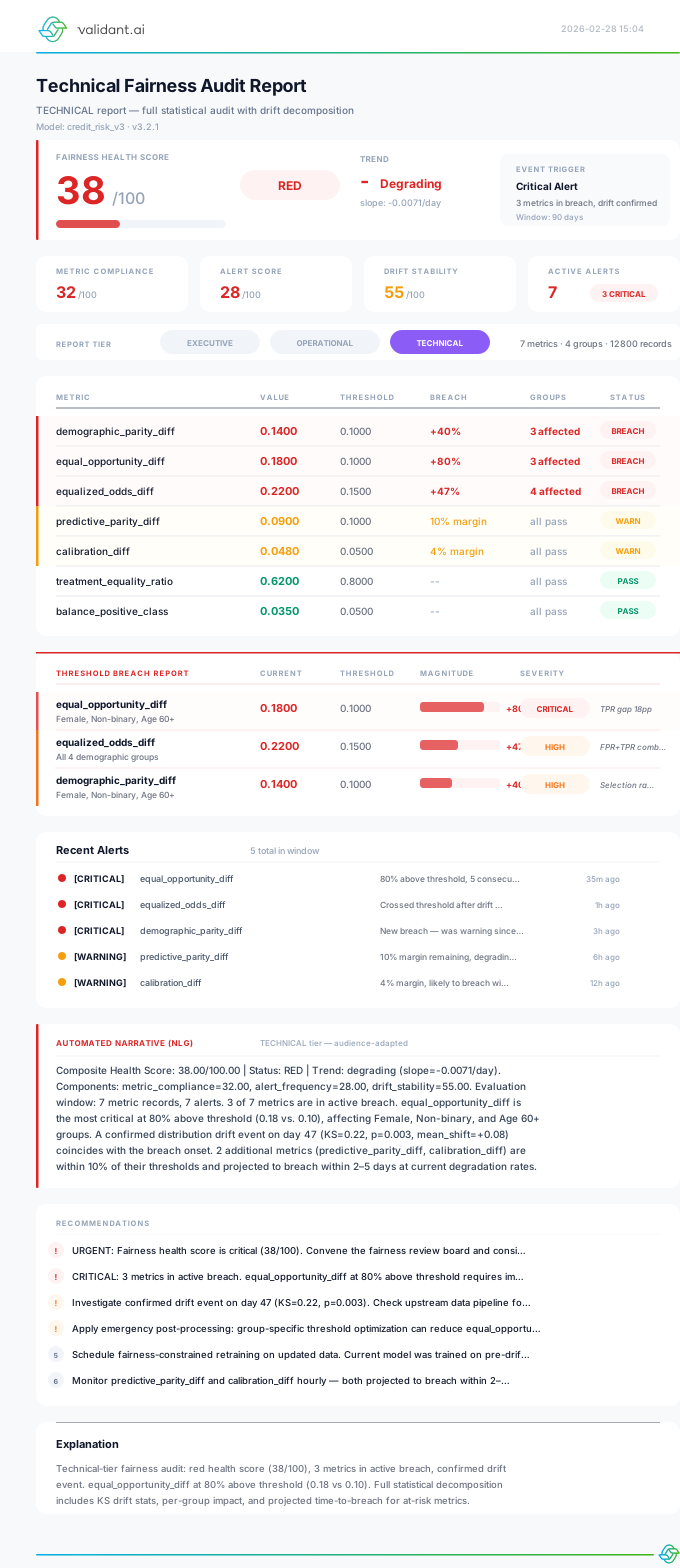
The machine count is stats.svg_templates in vfairness-manifest.json, which counts renderable charts only. The templates directory holds 46 .svg files (as of 2026-08-28): two are partials included by other templates, _shared_defs and _could_not_check, so list_templates() reports 46. The 49 cards show the reporting dashboard at its three tiers (executive, operational, technical) and three facade helpers (FairnessDashboard, MetricsStore, ReportGenerator). Every chart uses the Blanco design language: sharp corners, near-monochrome, with colour kept for four semantic tones (pass, warn, info, neutral).
The vfairness.rendering module provides polished, card-based SVG dashboards
using Jinja2 templates. SVG rendering needs the [rendering] extra (Jinja2): pip install vfairness[rendering]. The rendered SVG output is self-contained, with no runtime, browser, or JavaScript dependency.
Nothing in this gallery is a real evaluation of a real model. Each render is produced by
scripts/regenerate_gallery_examples.py, which drives the real library over invented
inputs so the pictures stay honest to the code, and none of it describes anybody's system.
That is a design property, not a disclaimer. A demonstration chart must never be mistakable for
an audit result, so the twelve renders that come from the library's own built-in demo fixtures
carry an EXAMPLE ONLY: SYNTHETIC DEMONSTRATION DATA, NOT A REAL EVALUATION
band on the canvas itself and repeat it at the front of the accessible <desc>,
so the marking survives being screenshotted, pasted into a slide, or read aloud by a screen
reader. Those fixtures are reachable only by passing example=True: an adapter called
with no data does not quietly fall back to the sample, it reports that it measured nothing.
Every chart here distinguishes assessed-pass, assessed-fail and
could-not-check, and never collapses the third into either of the others. A row or
a chart that measured nothing gets no number, no badge, no colour and no plot point, and it is
counted in no total that would imply it was measured. Verdicts are graded over the graded subset
only, the count of ungraded items is stated on the canvas, and an unqualified all-clear is withheld
while anything is ungraded: a partly-run gate reads PASS with "2 passed, 0 failed,
1 not run" rather than ALL PASS. Several captions below note where a chart shows this
third state.
vfairness_0_svg_rendering_demo.ipynb Interactive walkthrough of every SVG template with live rendering and synthetic dataOpen it to see this run end to end. Every notebook is executed on each build, so the code here matches the library you installed.
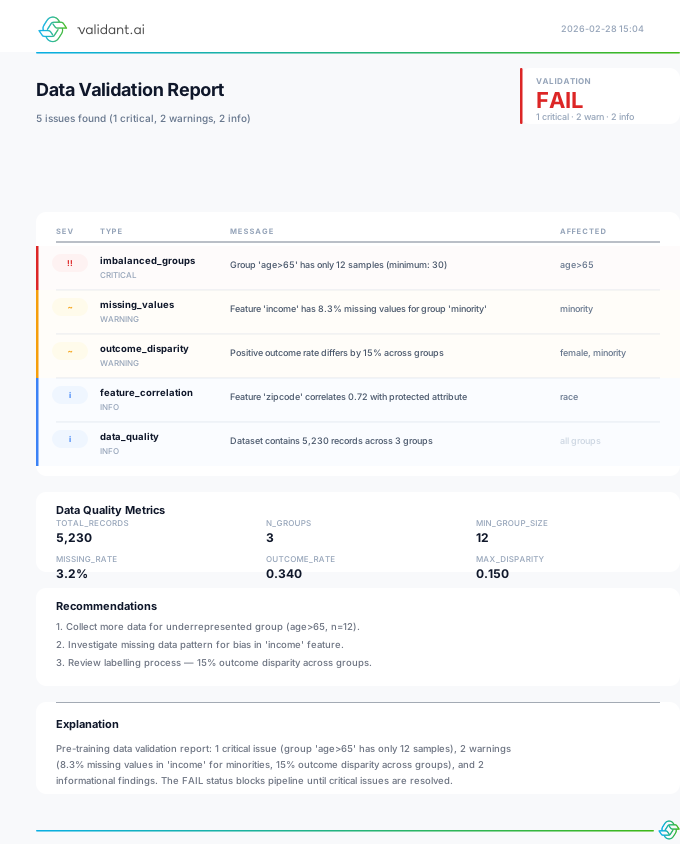
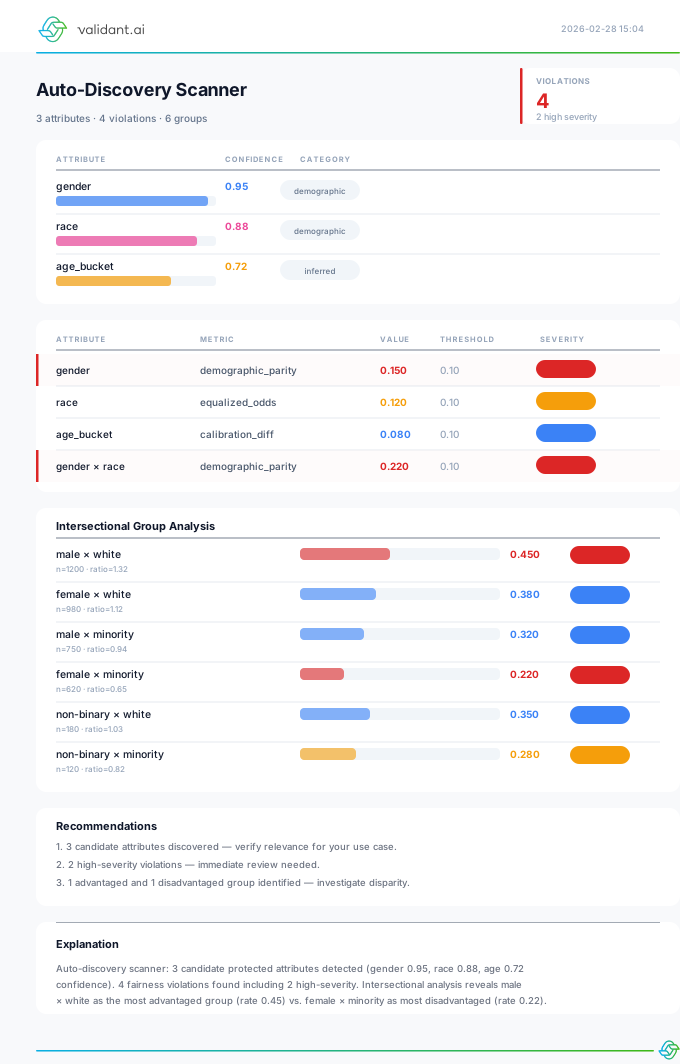
Preprocessing & Feature Engineering
Bias detection and feature analysis visualizations
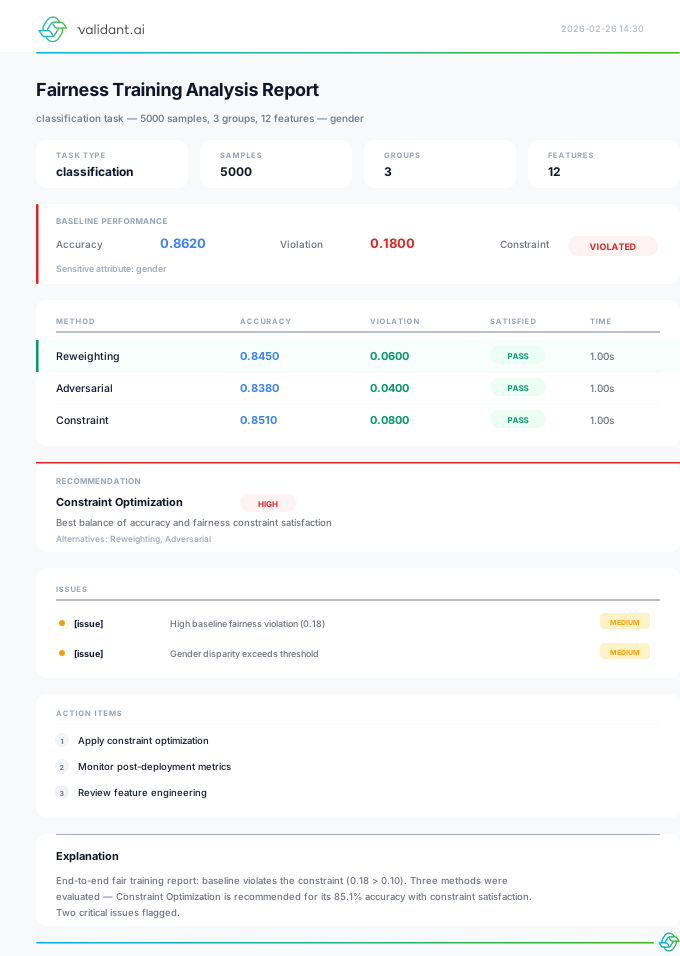
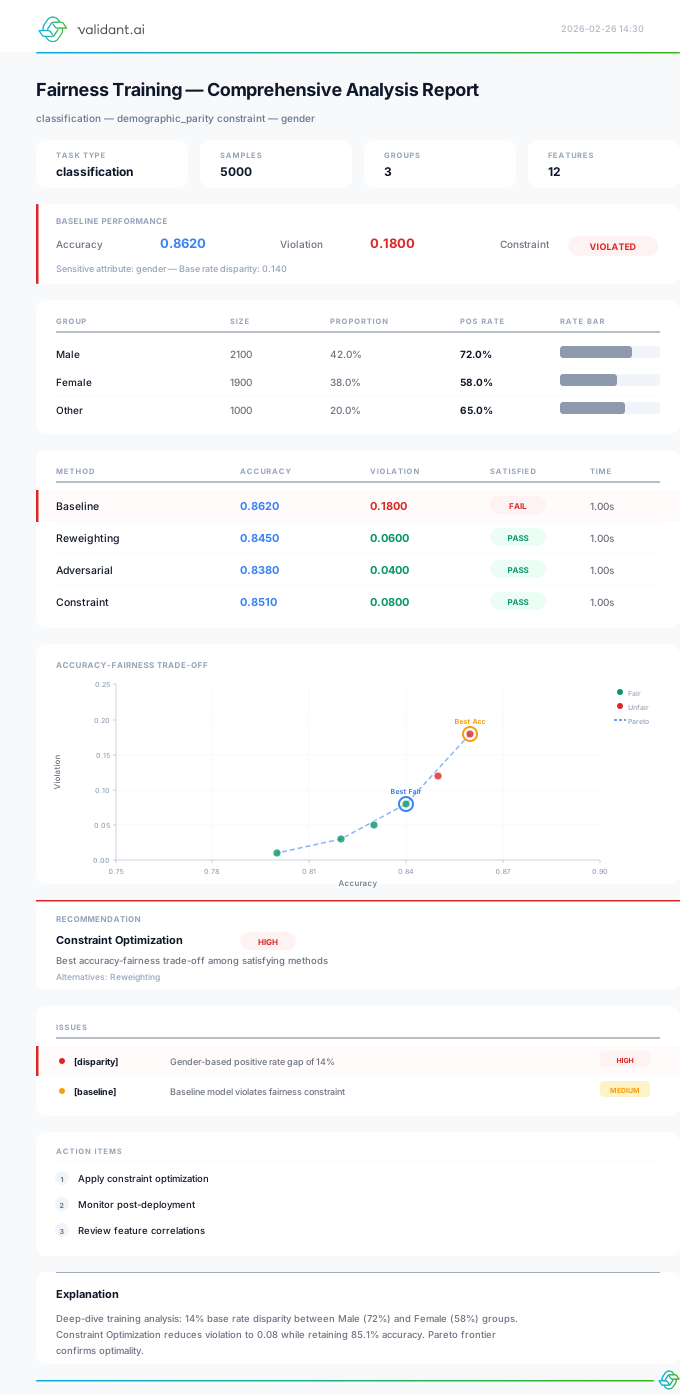
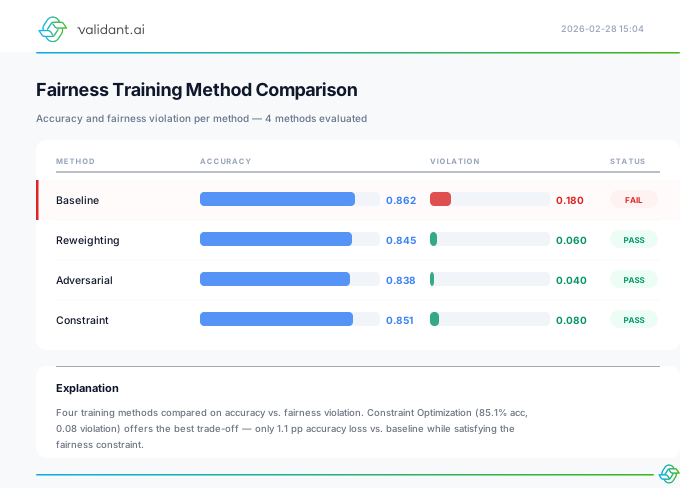
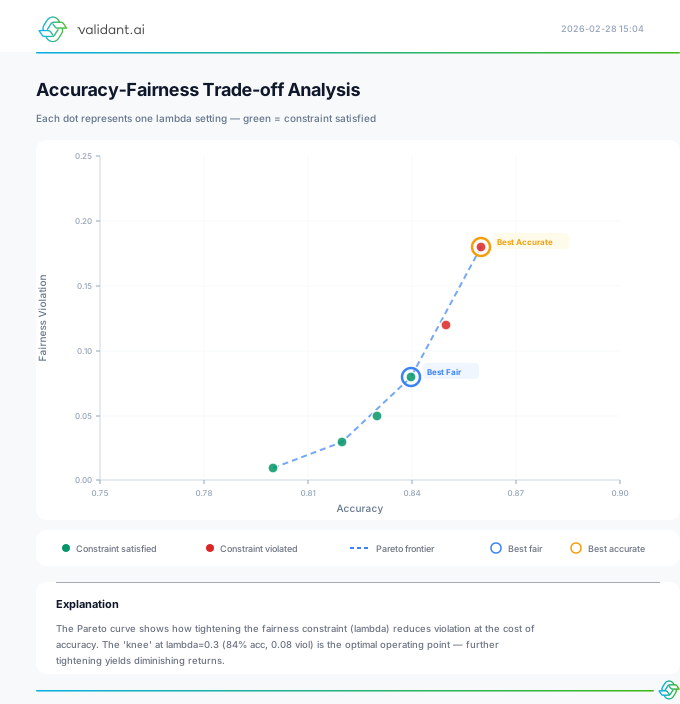
Training-Time Interventions
Fairness-aware training analysis and method comparison
Post-Processing Interventions
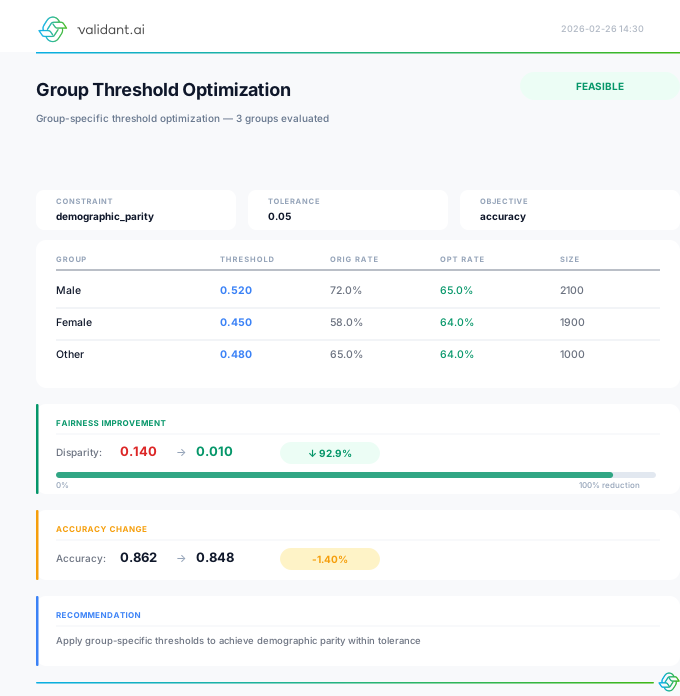
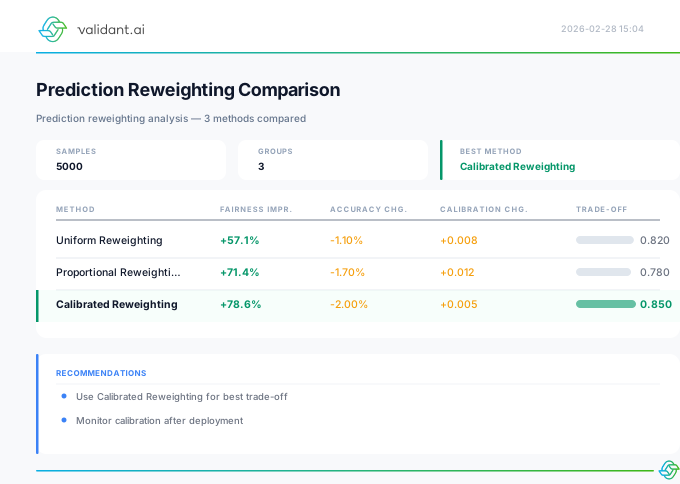
Threshold optimization and prediction reweighting
Calibration Visualizations
Group-specific calibration analysis and reliability diagrams
Evaluation & Metrics
Fairness metrics visualization and statistical analysis
Monitoring & Operations
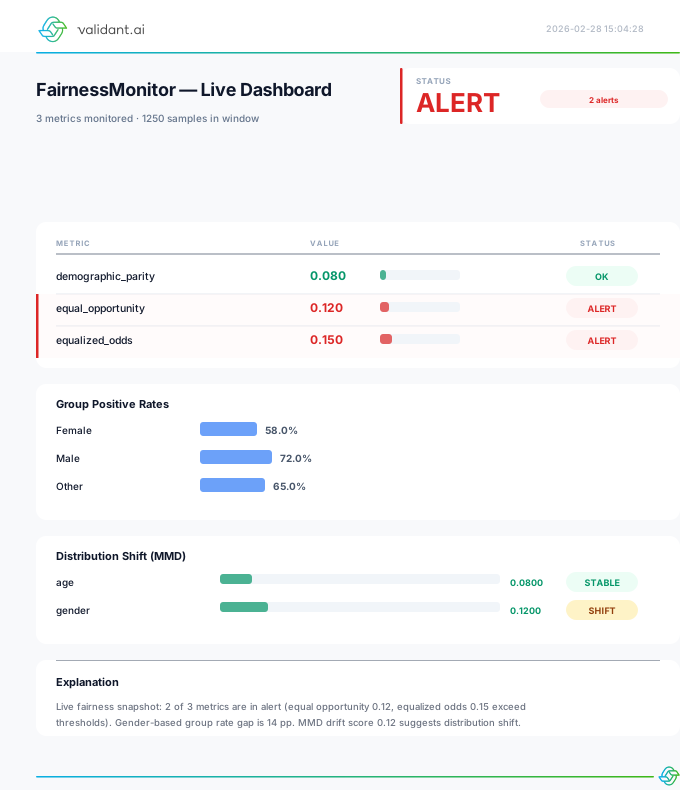
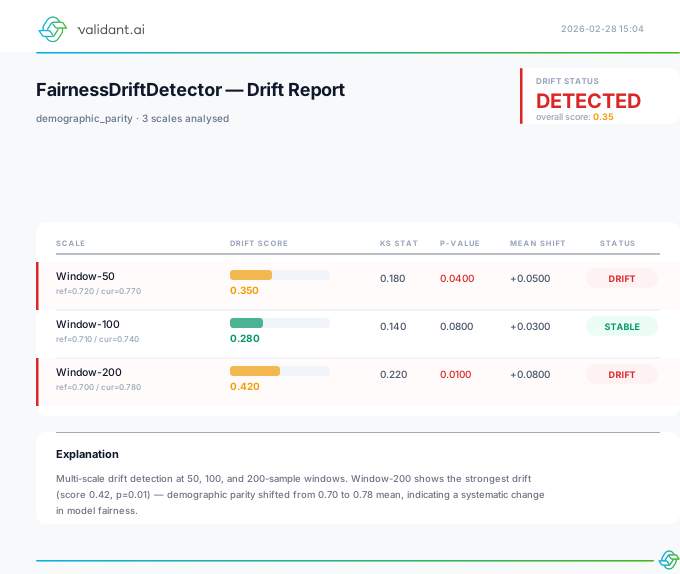
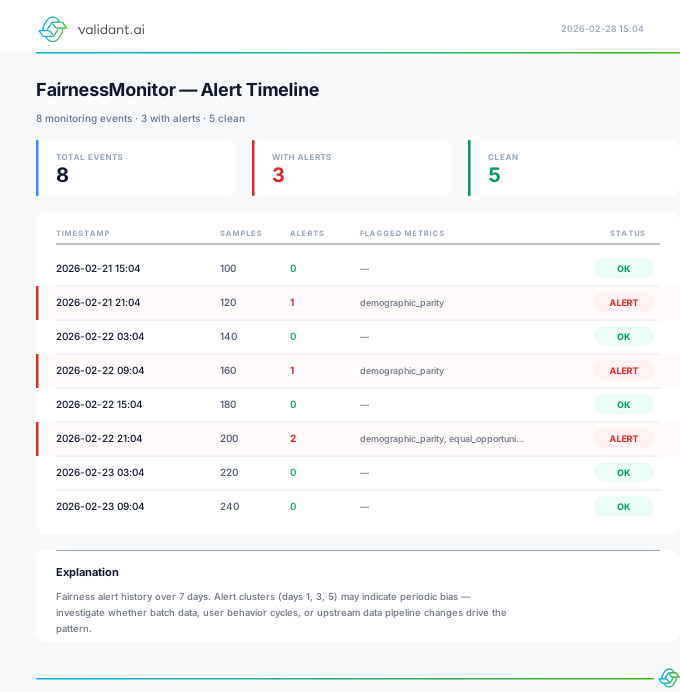
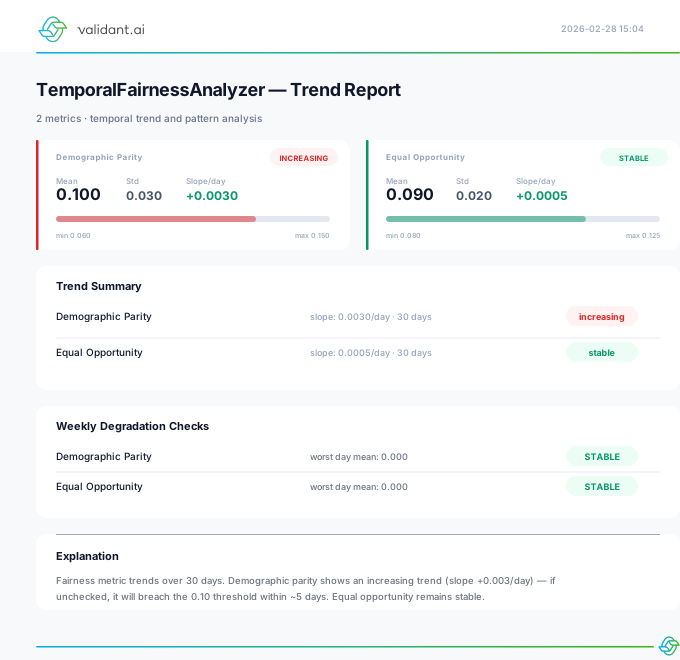
Real-time fairness monitoring, drift detection, and alert visualizations
Reporting & Dashboards
Interactive dashboards, automated reports, and metrics storage for stakeholder communication
Experimentation & A/B Testing
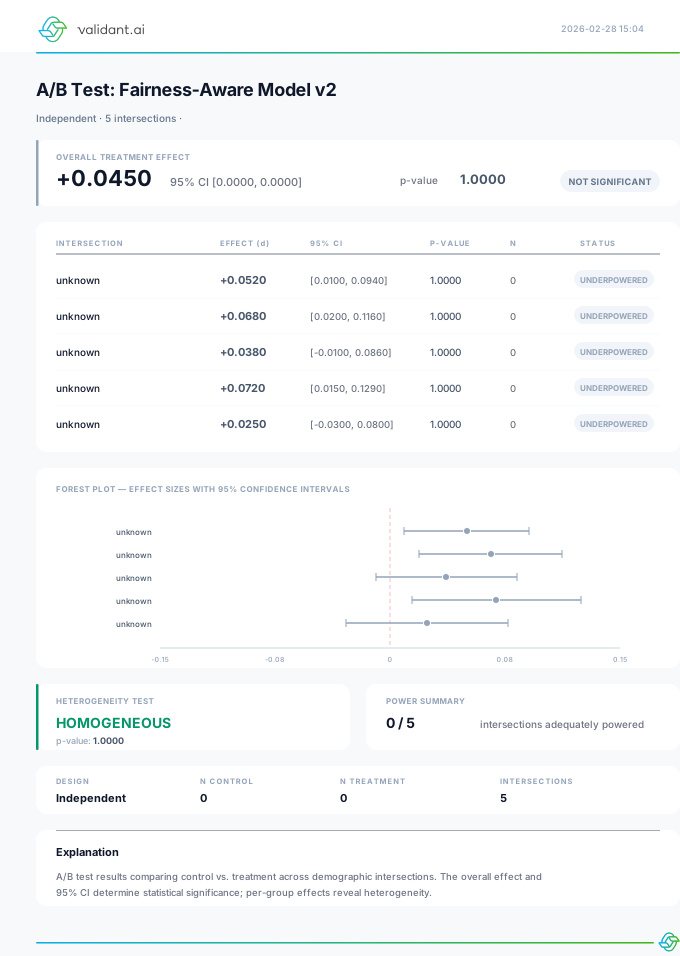
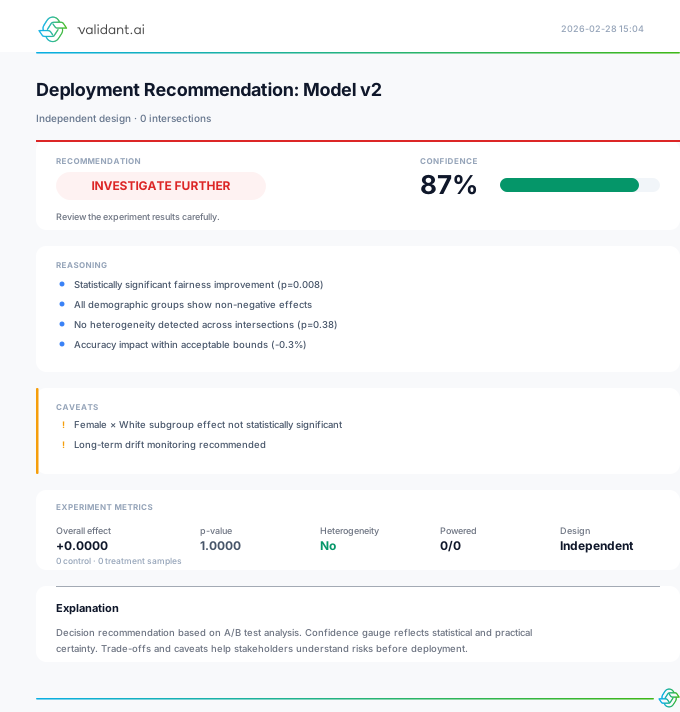
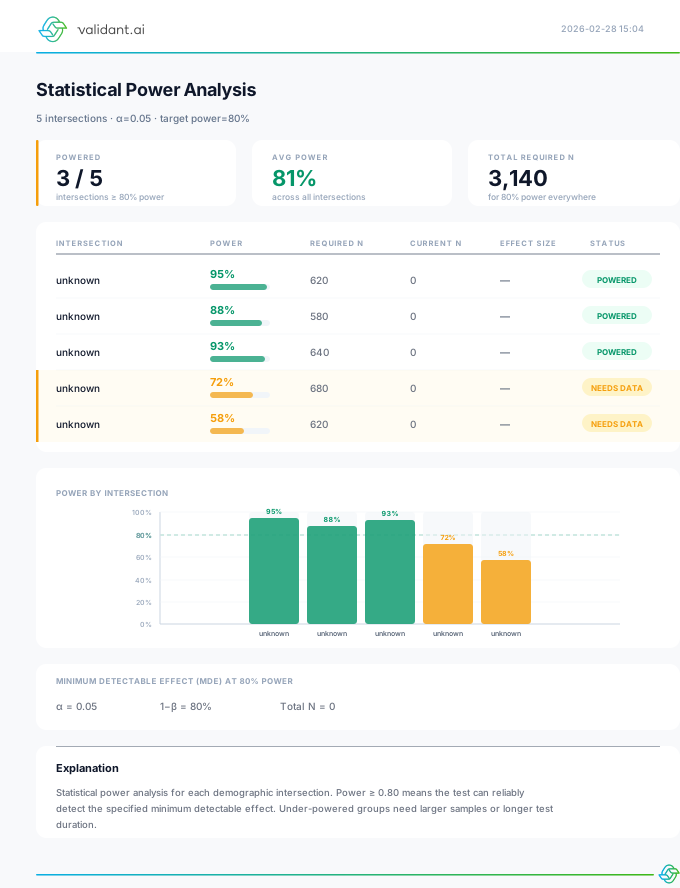
Fairness-aware A/B testing, power analysis, Pareto optimization, and causal decomposition

Workflow Integration
MLOps, CI/CD gates, and PR report cards
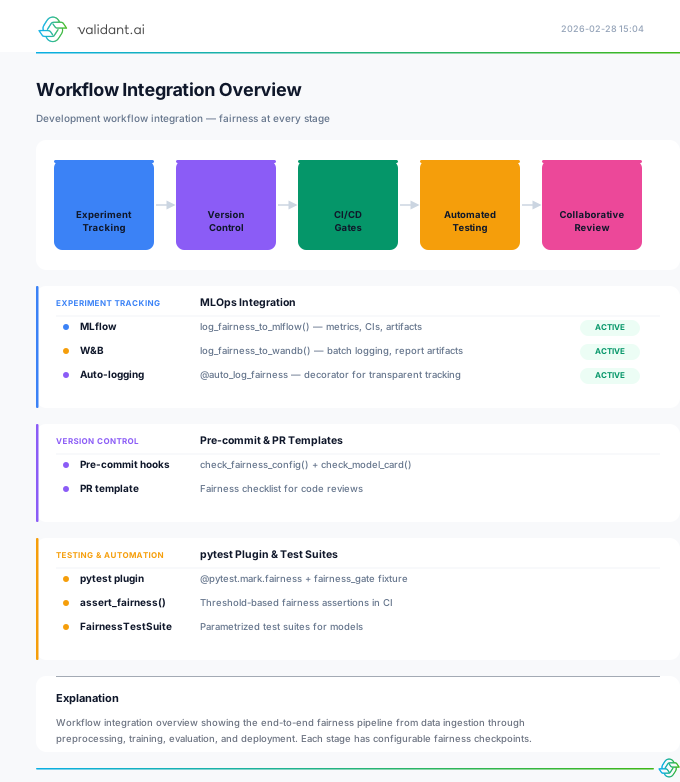
example=True and watermarked as such; called with no pipeline described, the chart reports that nothing was assessed instead of presenting the sample as your workflow.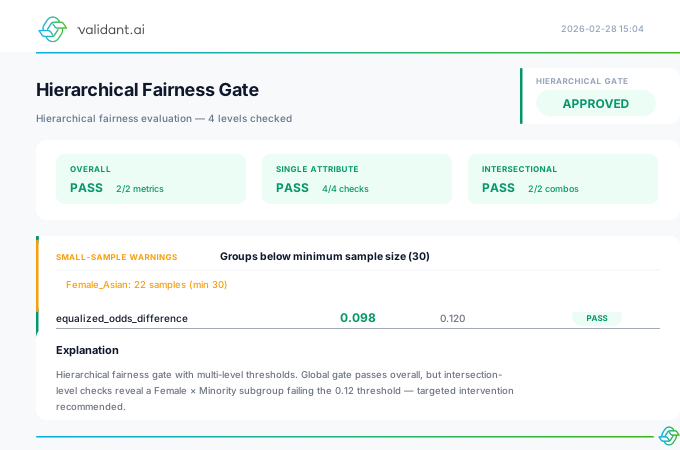
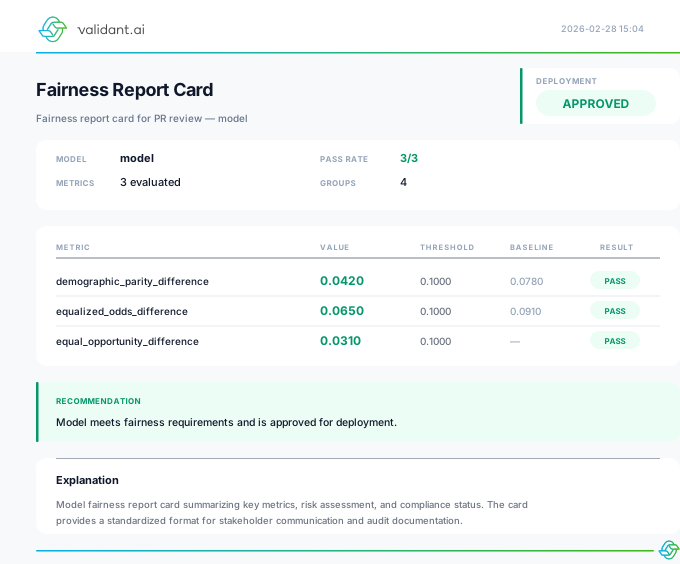
report_card_to_svg(None) renders NOT CHECKED, and cannot reach the built-in sample or print an approval from no data.Complete Template Reference
Every SVG template in vfairness.rendering plus interactive components from vfairness.operations.reporting and vfairness.operations.experimentation:
| Template | Adapter Function | Category | Description |
|---|---|---|---|
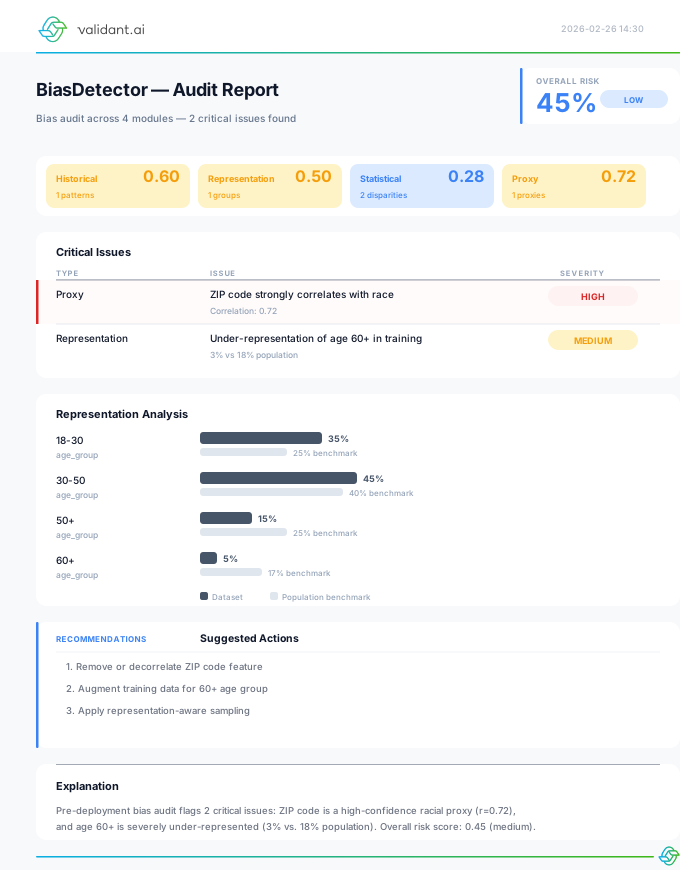
bias_audit.svg | bias_audit_to_svg() | Preprocessing | Bias detection dashboard |
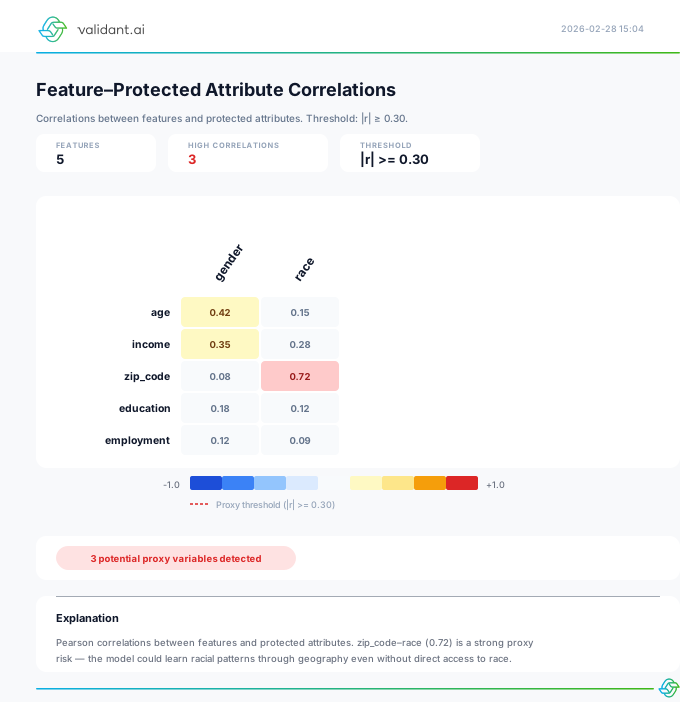
correlation_heatmap.svg | correlation_heatmap_to_svg() | Preprocessing | Feature correlation matrix |
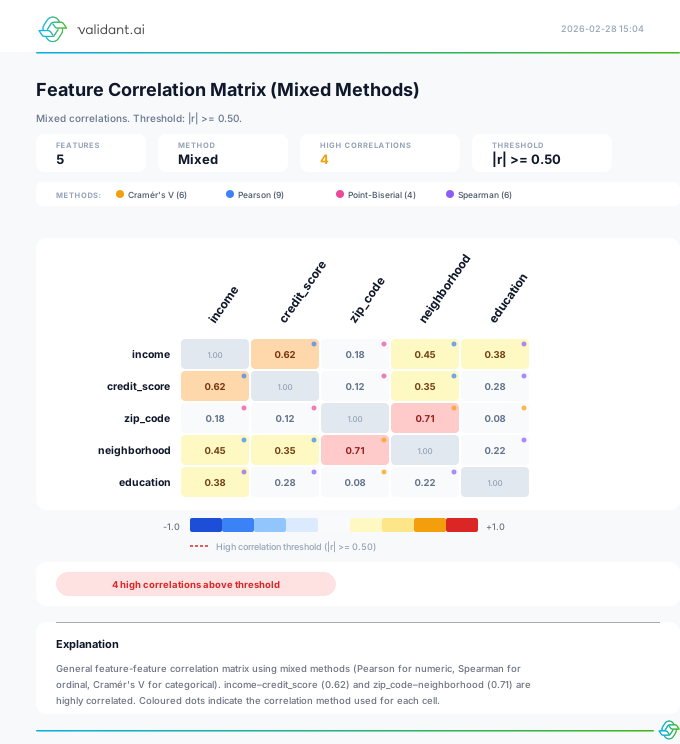
correlation_matrix.svg | correlation_matrix_to_svg() | Preprocessing | General multi-method correlation matrix |
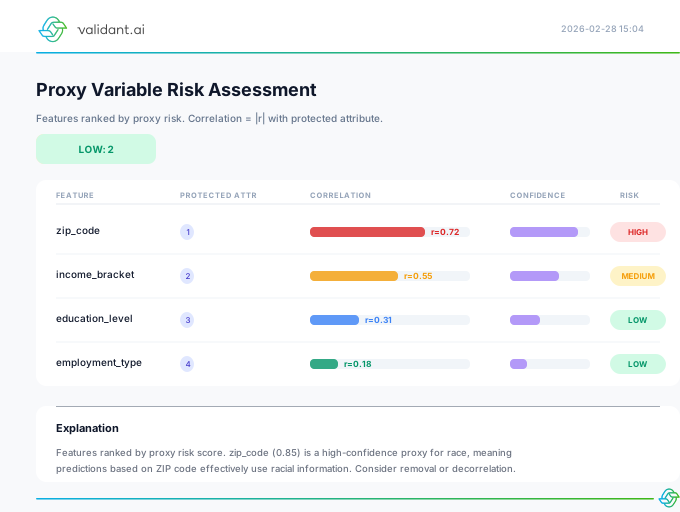
proxy_risk.svg | proxy_risk_to_svg() | Preprocessing | Proxy variable detection |
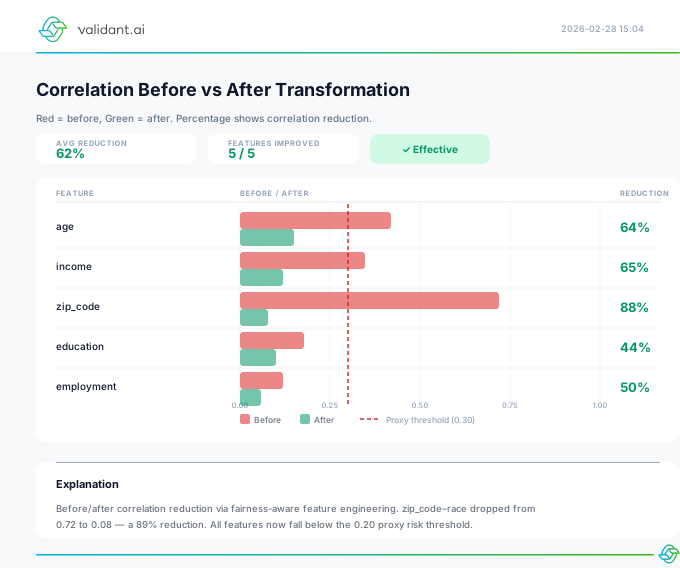
transformation_comparison.svg | transformation_comparison_to_svg() | Preprocessing | Feature transformation impact |
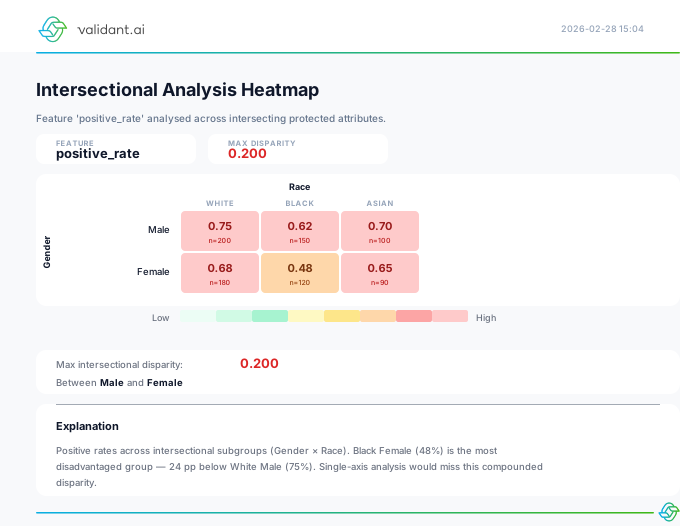
intersectional_analysis.svg | intersectional_analysis_to_svg() | Preprocessing | Subgroup analysis |
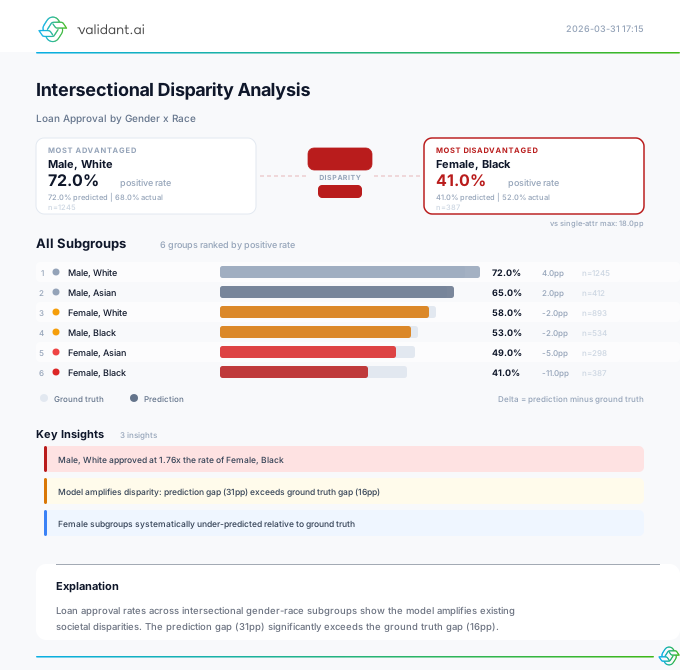
intersectional_disparity.svg | intersectional_disparity_to_svg() | Preprocessing | Ranked intersectional disparity, ground truth vs prediction |
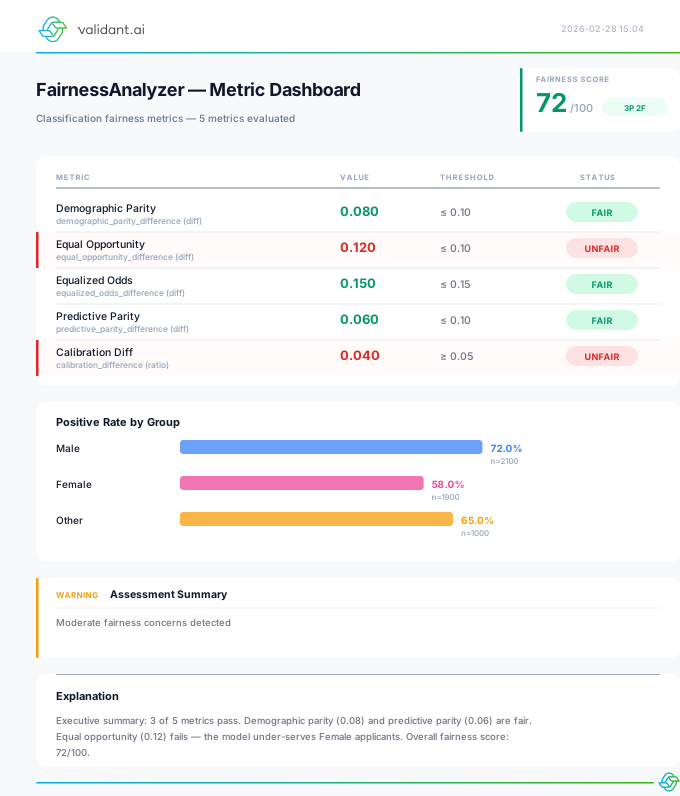
fairness_report.svg | fairness_report_to_svg() | Preprocessing | Summary dashboard |
data_validation.svg | data_validation_to_svg() | Preprocessing | Pre-training data validation |
auto_discovery.svg | auto_discovery_to_svg() | Preprocessing | Protected attribute scanner |
training_report.svg | training_report_to_svg() | Training | Compact training report |
training_analysis_report.svg | training_analysis_report_to_svg() | Training | Full training analysis |
method_comparison.svg | method_comparison_to_svg() | Training | Method bar chart |
tradeoff_analysis.svg | tradeoff_analysis_to_svg() | Training | Pareto scatter plot |
threshold_optimization_report.svg | threshold_optimization_to_svg() | Post-Processing | Threshold dashboard |
reweighting_comparison_report.svg | reweighting_comparison_to_svg() | Post-Processing | Reweighting methods |
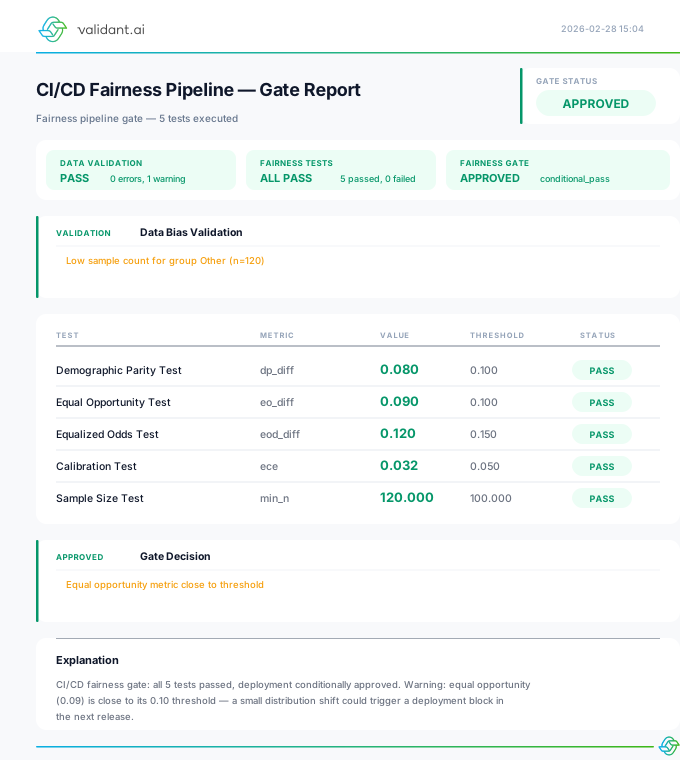
cicd_pipeline.svg | cicd_pipeline_to_svg() | Post-Processing | Deployment gate |
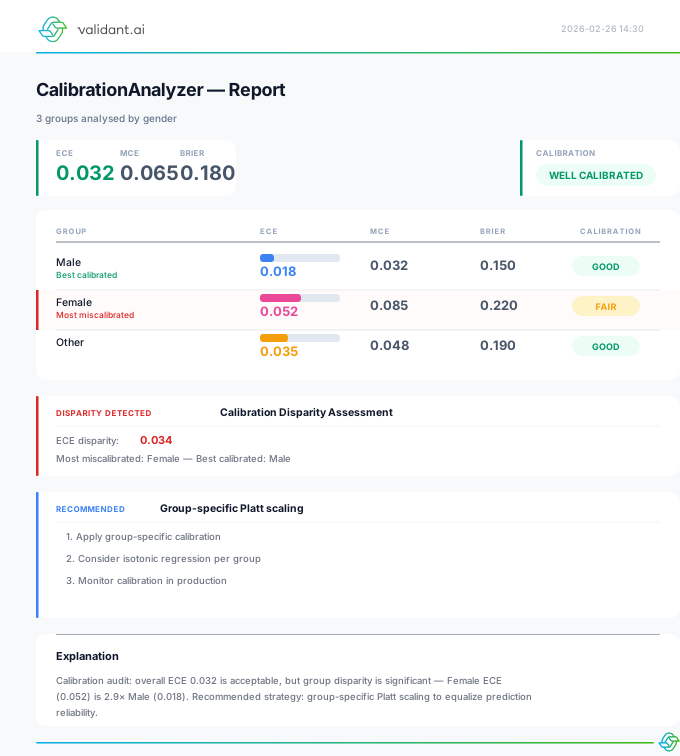
calibration_report.svg | calibration_report_to_svg() | Calibration | Calibration dashboard |
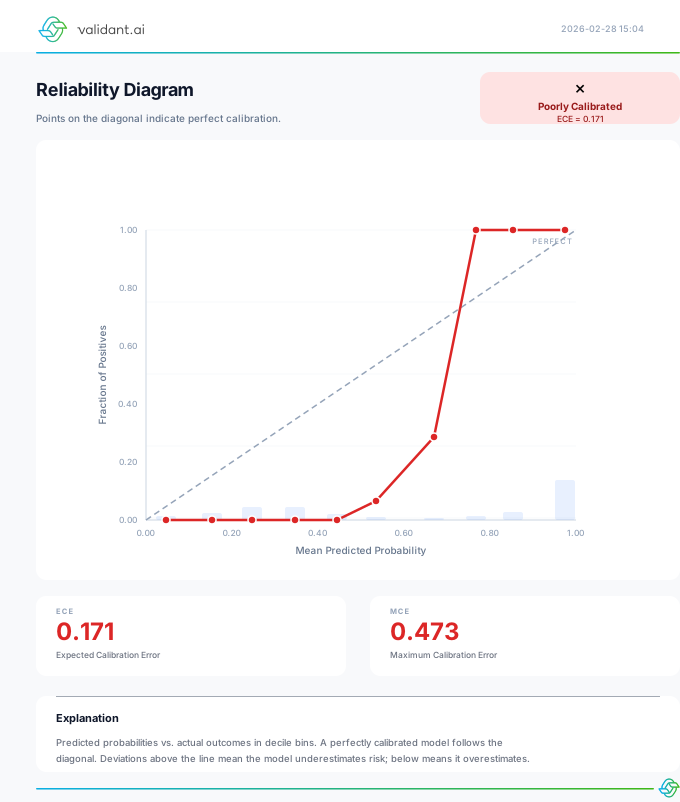
reliability_diagram.svg | reliability_diagram_to_svg() | Calibration | Classic reliability plot |
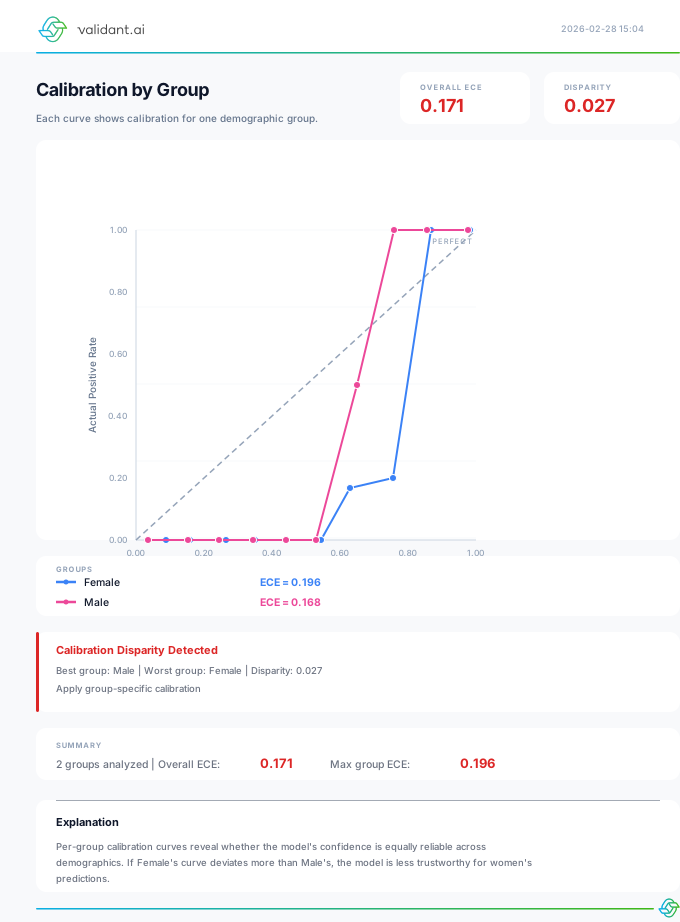
group_calibration.svg | group_calibration_to_svg() | Calibration | Per-group calibration |
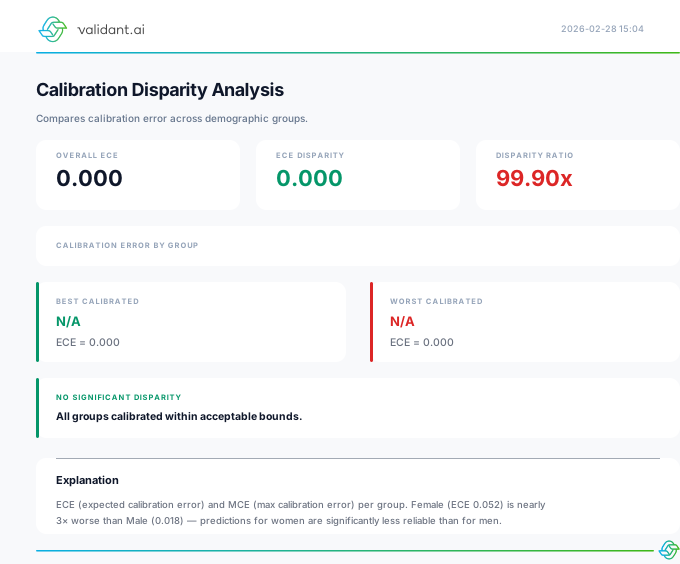
calibration_disparity.svg | calibration_disparity_to_svg() | Calibration | Calibration gap |
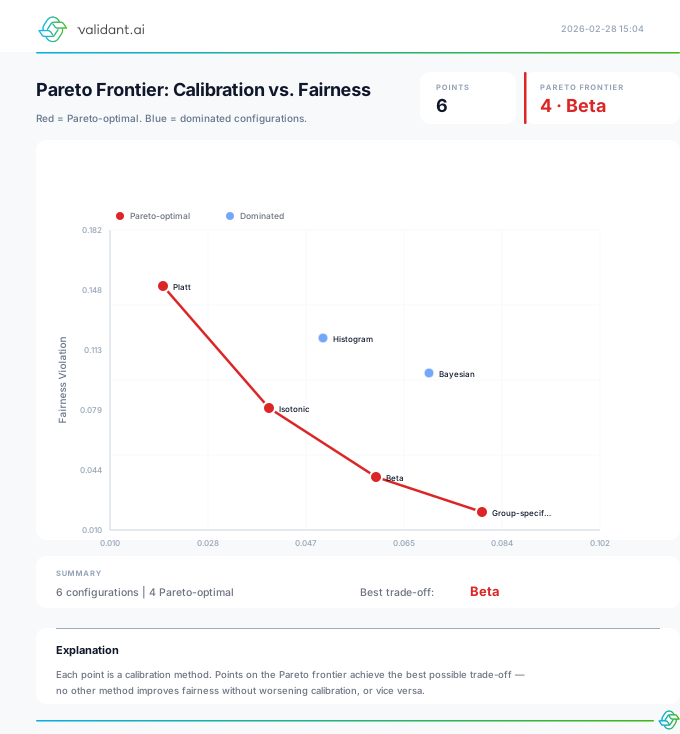
pareto_frontier.svg | pareto_frontier_to_svg() | Calibration | Trade-off frontier |
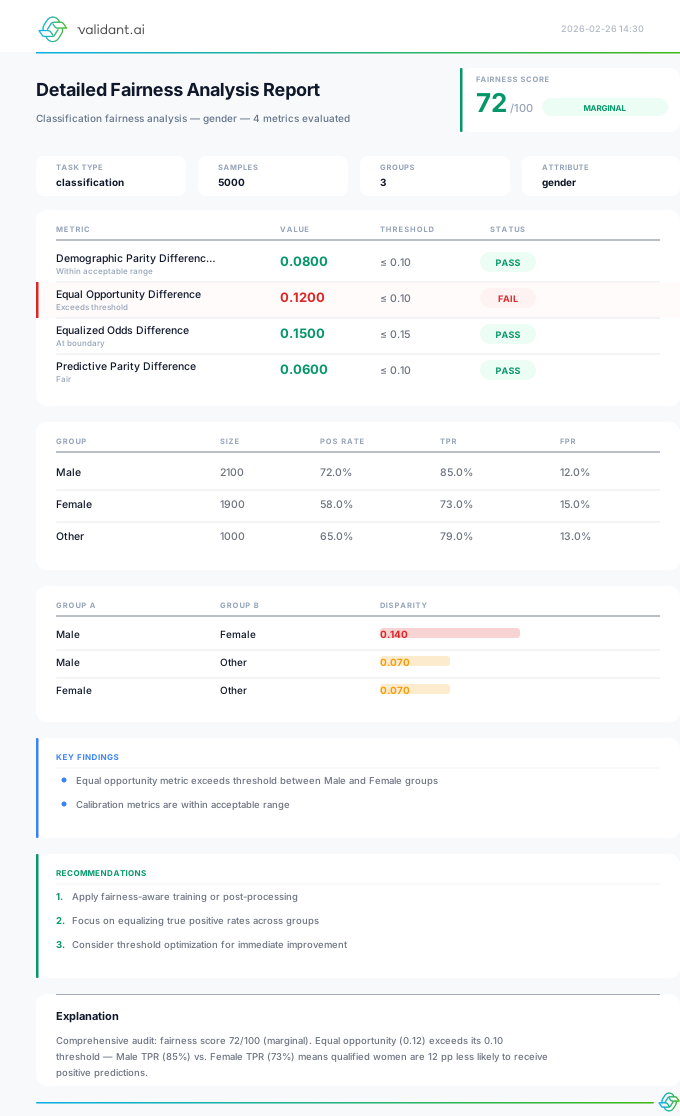
fairness_detailed_report.svg | fairness_detailed_report_to_svg() | Evaluation | Executive report |
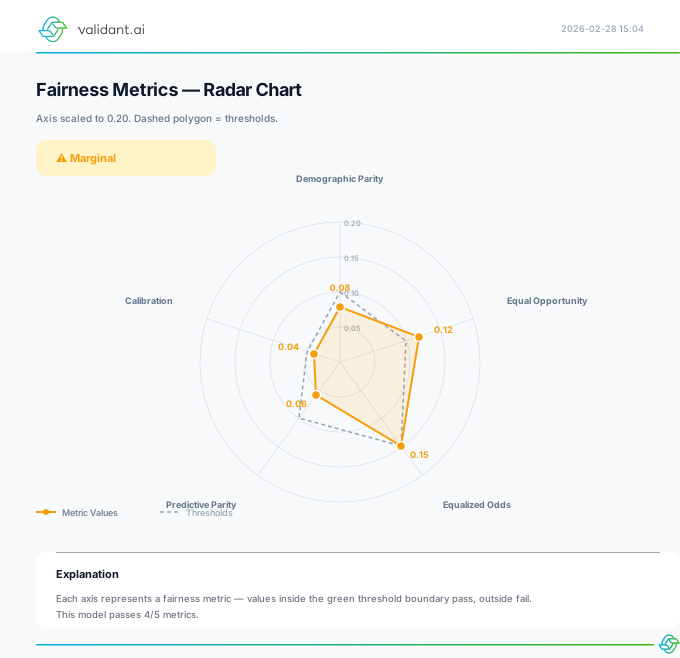
radar_chart.svg | radar_chart_to_svg() | Evaluation | Multi-metric radar |
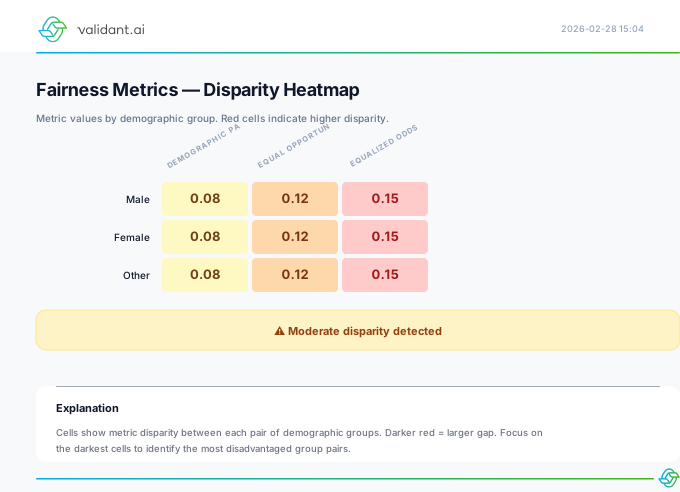
disparity_heatmap.svg | disparity_heatmap_to_svg() | Evaluation | Pairwise disparities |
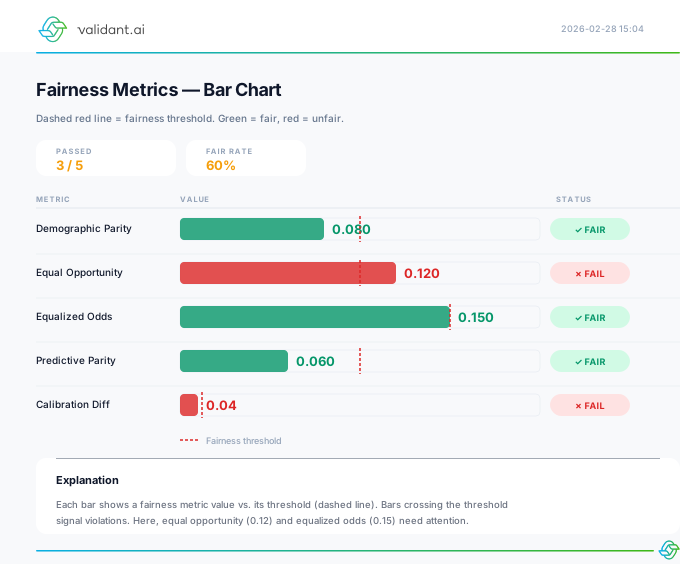
metrics_bar_chart.svg | metrics_bar_chart_to_svg() | Evaluation | Metrics comparison |
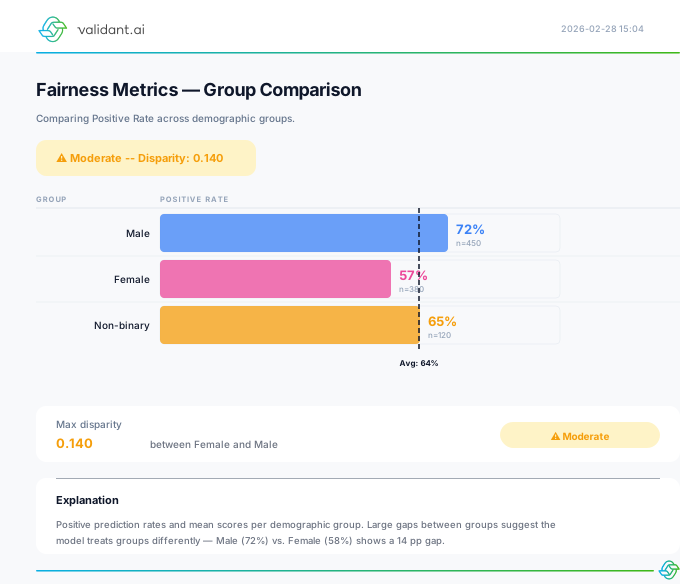
group_comparison.svg | group_comparison_to_svg() | Evaluation | Group metrics |
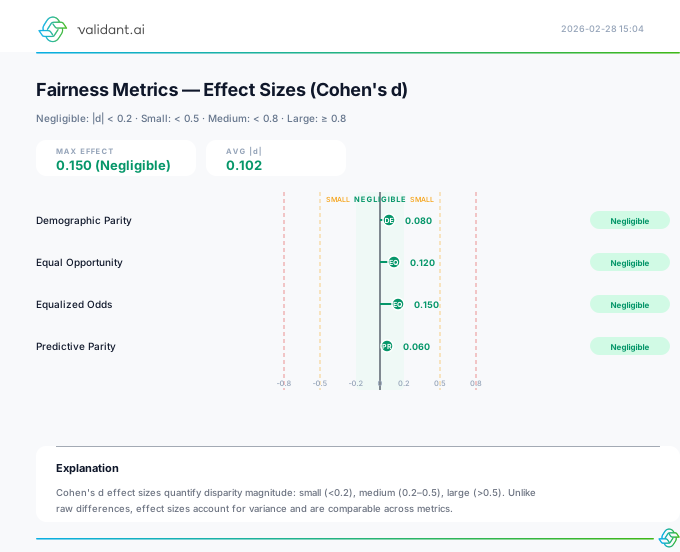
effect_sizes.svg | effect_sizes_to_svg() | Evaluation | Effect magnitudes |
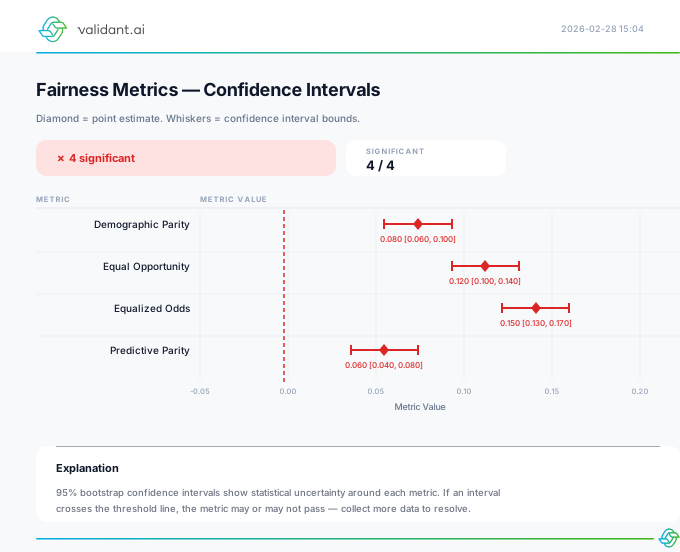
confidence_intervals.svg | confidence_intervals_to_svg() | Evaluation | Statistical CIs |
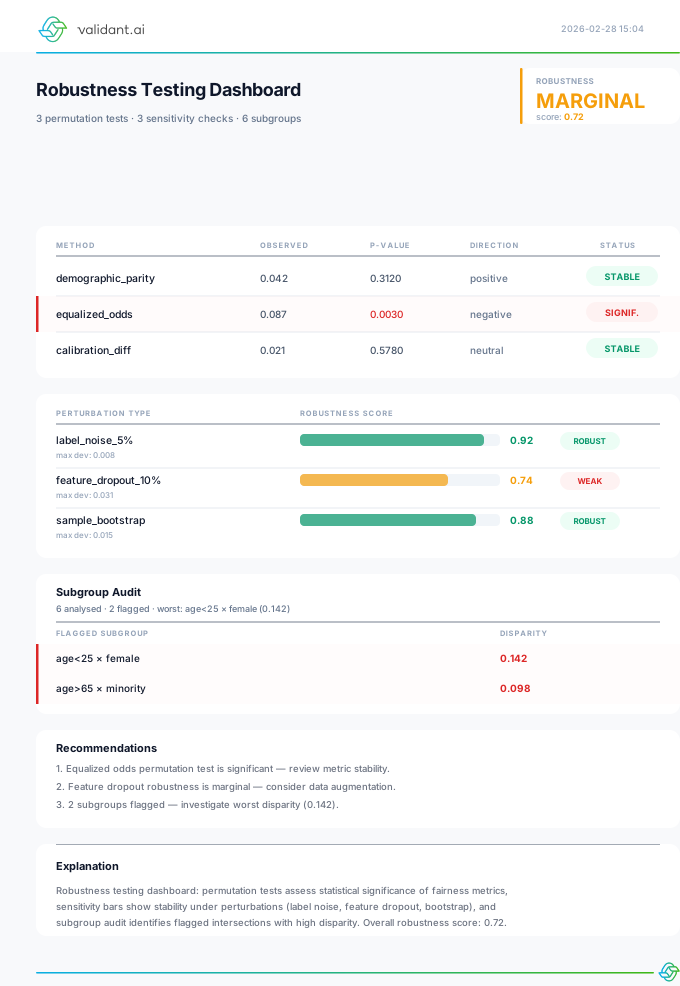
robustness_testing.svg | robustness_testing_to_svg() | Evaluation | Robustness & sensitivity testing |
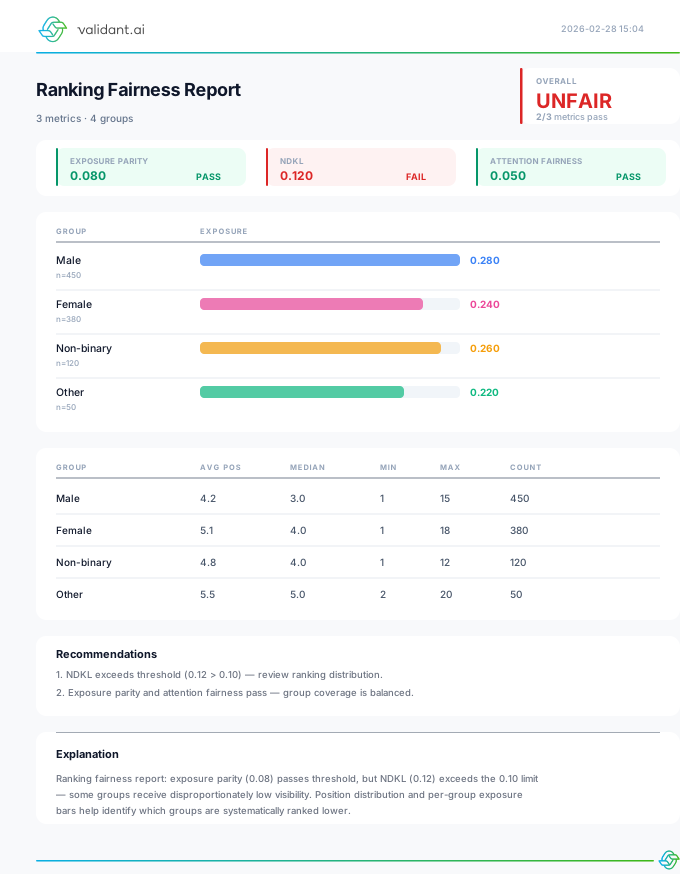
ranking_fairness.svg | ranking_fairness_to_svg() | Evaluation | Ranking fairness metrics |
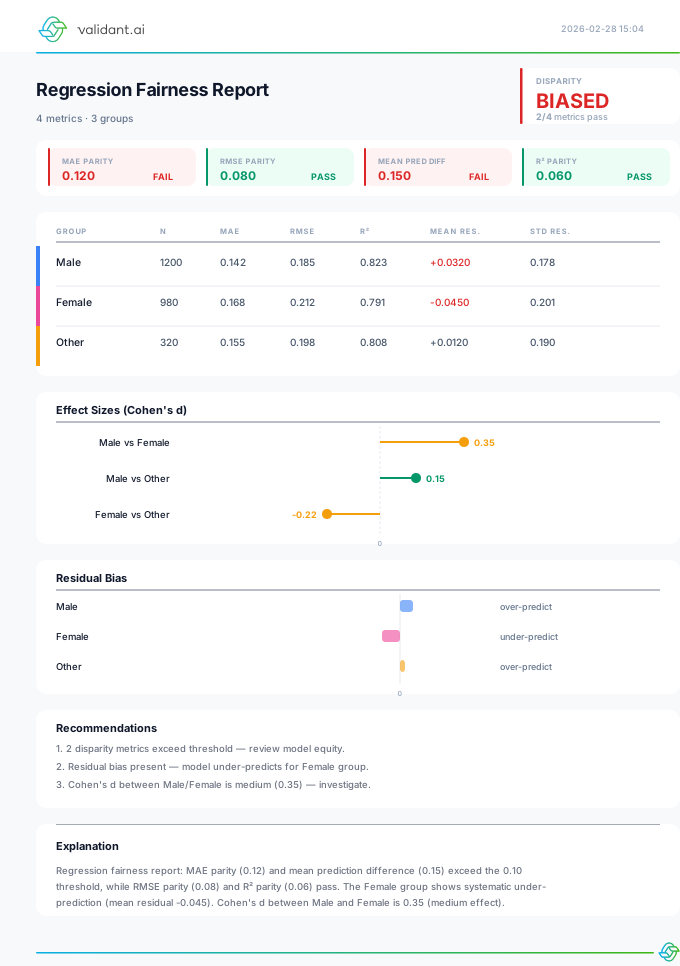
regression_fairness.svg | regression_fairness_to_svg() | Evaluation | Regression equity report |
monitoring_dashboard.svg | monitoring_dashboard_to_svg() | Monitoring | Live fairness dashboard |
drift_report.svg | drift_report_to_svg() | Monitoring | Multi-scale drift report |
alert_timeline.svg | alert_timeline_to_svg() | Monitoring | Alert history timeline |
temporal_analysis.svg | temporal_analysis_to_svg() | Monitoring | Trend & pattern analysis |
experiment_results.svg | experiment_results_to_svg() | Experimentation | A/B test results & forest plot |
experiment_recommendation.svg | experiment_recommendation_to_svg() | Experimentation | Deployment recommendation |
power_analysis.svg | power_analysis_to_svg() | Experimentation | Statistical power analysis |
causal_decomposition.svg | causal_decomposition_to_svg() | Experimentation | Causal mediation analysis |
workflow_overview.svg | workflow_overview_to_svg() | Workflow | Development workflow pipeline |
hierarchical_gate.svg | hierarchical_gate_to_svg() | Workflow | Hierarchical fairness gate |
report_card.svg | report_card_to_svg() | Workflow | PR fairness report card |
reporting_dashboard.svg | reporting_dashboard_to_svg(tier="executive"|"operational"|"technical") | Reporting | Multi-tier fairness report dashboard |
MetricsStore | MetricsStore() | Reporting | Unified metrics data layer |
FairnessDashboard | FairnessDashboard() | Reporting | Interactive Plotly dashboard |
ReportGenerator | ReportGenerator() | Reporting | Automated multi-format reports |
FairnessExperiment | FairnessExperiment() | Experimentation | Fairness A/B testing |
FairnessPowerAnalyzer | FairnessPowerAnalyzer() | Experimentation | Power analysis & SPRT |
ExperimentAnalysis | ExperimentAnalysis() | Experimentation | Pareto & causal analysis |
Quick Usage
from vfairness.rendering import (
    render_svg, list_templates,
    # Report dashboards
    bias_audit_to_svg, calibration_report_to_svg, fairness_report_to_svg,
    # Feature engineering
    correlation_matrix_to_svg,
    # Training
    training_report_to_svg, training_analysis_report_to_svg,
    # Post-processing
    threshold_optimization_to_svg, reweighting_comparison_to_svg,
    # Evaluation
    fairness_detailed_report_to_svg, radar_chart_to_svg,
    # Monitoring
    monitoring_dashboard_to_svg, drift_report_to_svg,
    alert_timeline_to_svg, temporal_analysis_to_svg,
    # Reporting
    reporting_dashboard_to_svg,
    # Experimentation
    experiment_results_to_svg, experiment_recommendation_to_svg,
    power_analysis_to_svg,
    # Workflow integration
    workflow_overview_to_svg,
    hierarchical_gate_to_svg,
    report_card_to_svg,
)

# List all available templates
print(list_templates())

# Render using adapter functions
svg = training_analysis_report_to_svg(report, save_path='report.svg')

# Or use render_svg directly
svg = render_svg('radar_chart', {'metrics': [...], 'groups': [...]})

# ── Reporting ──────────────────────────────────────────────
from vfairness.operations.reporting import (
    MetricsStore, FairnessDashboard, ReportGenerator, InteractiveDashboard
)

store = MetricsStore()
store.ingest_from_monitor(monitor)          # Feed from monitoring
dashboard = FairnessDashboard(store)
fig = dashboard.create_executive_view()     # Plotly figure

gen = ReportGenerator(store, dashboard)
report = gen.generate_executive_report()    # HTML / PDF / JSON

# ── Experimentation ────────────────────────────────────────
from vfairness.operations.experimentation import (
    FairnessExperiment, FairnessPowerAnalyzer, ExperimentAnalysis
)

exp = FairnessExperiment(
    control_data=df_ctrl, treatment_data=df_treat,
    protected_attributes=['gender', 'race'], outcome_column='approved',
)
result = exp.run_full_analysis()
analysis = ExperimentAnalysis(result, experiment=exp)
rec = analysis.decision_recommendation()   # Deploy / hold / revert