
Sample assessment · ranking
Job platform fairness assessment
A complete audit of a job platform ranking system, from proxy detection and fair re-ranking to feedback-loop monitoring and the EU AI Act model card.
Overview
This walkthrough demonstrates a complete fairness audit of a ranking/recommender system using the vfairness library. Unlike binary classifiers, ranking systems introduce unique fairness challenges: exposure allocation, position bias, and feedback loops where biased rankings generate biased engagement data that reinforces the original bias.
By following this guide, you will produce: a validated click-data audit, exposure parity analysis, engagement proxy detection, fair re-ranking evaluation, ranking-specific metrics (NDKL, attention fairness), CI/CD gates with ranking thresholds, feedback-loop monitoring, an A/B experiment comparing fair vs. baseline ranking, causal decomposition of ranking bias, and an EU AI Act–compliant model card — all backed by a complete set of production-grade SVG artifacts, itemised in the Complete Artifact Inventory below.
The dataset, the model and every number in the Findings boxes below are invented to show the shape of a complete audit. No file named here ships with the library, so the walkthrough is not reproducible end to end as written, and nothing on this page is a measurement of a real system. The code is real and the call signatures are checked against the library; the results are illustration.
The Scenario
Job Platform Candidate Ranking — EU AI Act High-Risk System
A professional hiring platform deploys a learning-to-rank model (LambdaMART) to order candidates for recruiter search results. Under the EU AI Act (Annex III, Section 4a), AI systems intended to be used for recruitment or selection of natural persons, particularly for screening, filtering, or ranking candidates, are classified as high-risk AI, requiring comprehensive fairness documentation, ongoing monitoring, and human oversight.
import pandas as pd
import numpy as np
from lightgbm import LGBMRanker

# ── Load the candidate ranking dataset ──
df = pd.read_csv("candidate_profiles.csv")
clicks = pd.read_csv("recruiter_clicks.csv")  # historical engagement data

# Protected attributes
PROTECTED = ["gender", "ethnicity", "age_group"]
FEATURES  = ["skills_match", "experience_years", "education_score",
             "profile_completeness", "past_engagement_rate",
             "recency_score", "keyword_overlap"]

# Merge engagement signals
df = df.merge(clicks.groupby("candidate_id").agg(
    click_rate=("clicked", "mean"),
    impressions=("impression_id", "count"),
), on="candidate_id", how="left").fillna(0)

# Train learning-to-rank model
ranker = LGBMRanker(objective="lambdarank", n_estimators=300, max_depth=6)
ranker.fit(
    X_train[FEATURES], y_train_relevance,
    group=train_query_groups,
    eval_set=[(X_val[FEATURES], y_val_relevance)],
    eval_group=[val_query_groups],
)
scores = ranker.predict(X_test[FEATURES])
rankings = scores.argsort()[::-1]  # descending score → rank
Audit Pipeline
The ten phases below are adapted for ranking systems. Key differences from classification audits: Phase 3 targets engagement-signal proxies, Phase 4 uses post-processing re-ranking (not in-processing), Phase 6 adds ranking-specific metrics (NDKL, exposure parity), and Phase 9 runs a controlled A/B experiment with causal decomposition.
Validation
Detection
Detection
Re-ranking
Calibration
Fairness
Gating
Testing
Card
Data Validation
Validate the training data — both candidate profiles and historical click/engagement data — for representation balance, missing patterns, and position-bias contamination. Click data is particularly vulnerable to feedback loops: candidates historically ranked lower receive fewer impressions, generating less engagement data regardless of their true relevance.
from vfairness.operations.cicd import DataBiasValidator, DataValidationConfig

validator = DataBiasValidator(
    protected_attributes=PROTECTED,
    config=DataValidationConfig(
        min_samples_per_group=200,     # higher bar for ranking (more groups, more queries)
        missing_value_threshold=0.03,
    ),
)
result = validator.validate(df, outcome_column="click_rate")

print(f"Passed: {result.passed}")
print(f"Issues: {len(result.issues)}")

# ── Generate SVG artifact ──
from vfairness.rendering import data_validation_to_svg

data_validation_to_svg(
    result,
    explanation="Pre-training data quality assessment for the candidate ranking dataset. "
                "Checks group representation, missing patterns, engagement feature correlations, "
                "and position-bias contamination in historical click data.",
    save_path="artifacts/01_data_validation.svg",
)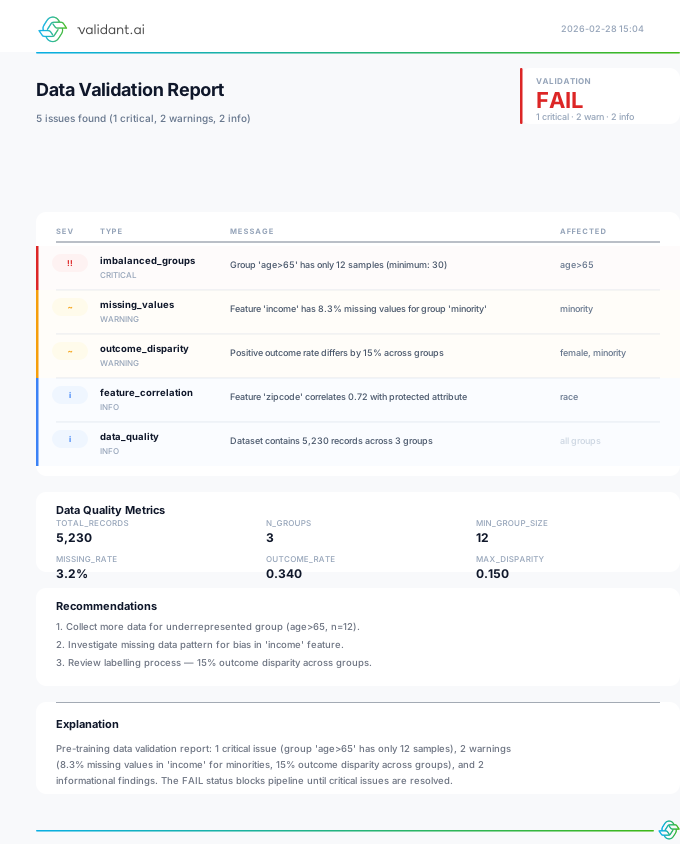
1 critical issue (engagement data click_rate is confounded with historical position — candidates from underrepresented groups had 40% fewer average impressions), 2 warnings (low representation for age_group=55+), 2 informational notes. Position-bias decontamination required before model training.
Bias Detection & Auto-Discovery
Run the auto-discovery scanner to identify protected attributes, then perform a full bias audit. For ranking systems, bias detection examines both representation in the candidate pool and exposure distribution in historical rankings — who appears in the top positions and how often.
from vfairness.evaluation.vfairness_metrics import (
    detect_protected_attributes,
    scan_fairness_violations,
    discover_intersectional_groups,
)
from vfairness.preprocessing.bias_detection import BiasDetector
from vfairness.rendering import auto_discovery_to_svg, bias_audit_to_svg

# ── Auto-discovery: confirm protected attributes ──
# binarized "top half of scores" view for the discovery scan
y_top = (scores > np.median(scores)).astype(int)

candidates = detect_protected_attributes(df)
violations = scan_fairness_violations(X_test, y_top)
intersectional = discover_intersectional_groups(X_test, PROTECTED, y_top)

auto_discovery_to_svg(
    candidates=candidates, violations=violations,
    group_advantages=intersectional,
    explanation="Automated scan confirming gender, ethnicity, and age_group as protected "
                "attributes. Intersectional analysis reveals compounding disadvantage.",
    save_path="artifacts/02a_auto_discovery.svg",
)

# ── Full bias audit ──
detector = BiasDetector(df, protected_attributes=PROTECTED, outcome_column="click_rate")
audit = detector.full_audit()

bias_audit_to_svg(
    audit,
    explanation="Comprehensive bias audit of historical engagement data. Click rates "
                "confounded with exposure — disparities may reflect position bias, not preference.",
    save_path="artifacts/02b_bias_audit.svg",
)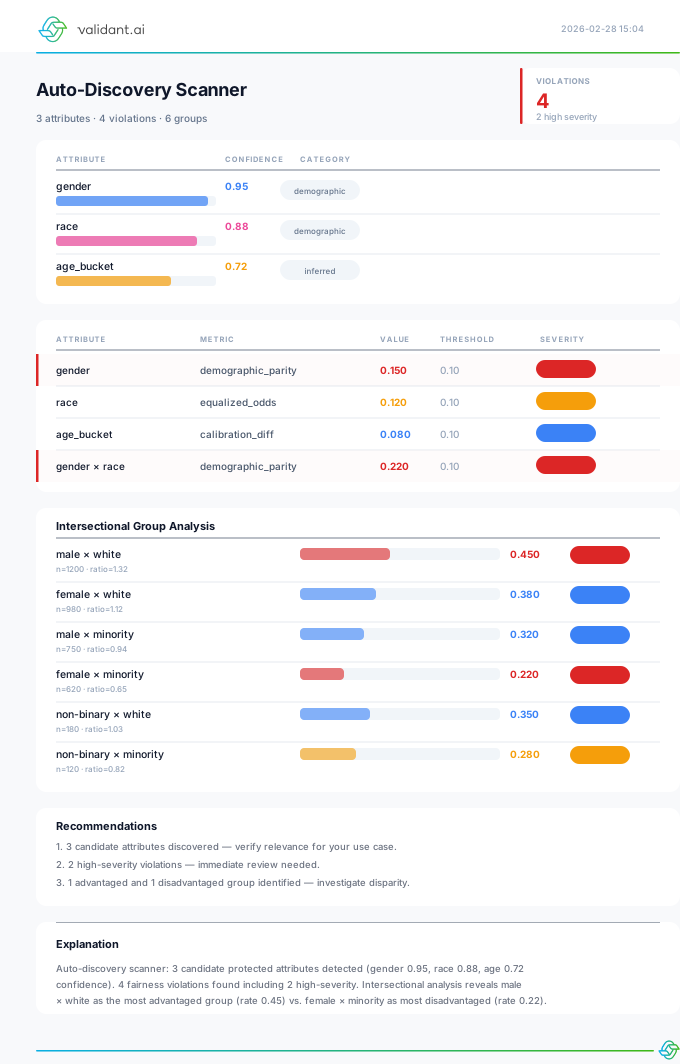
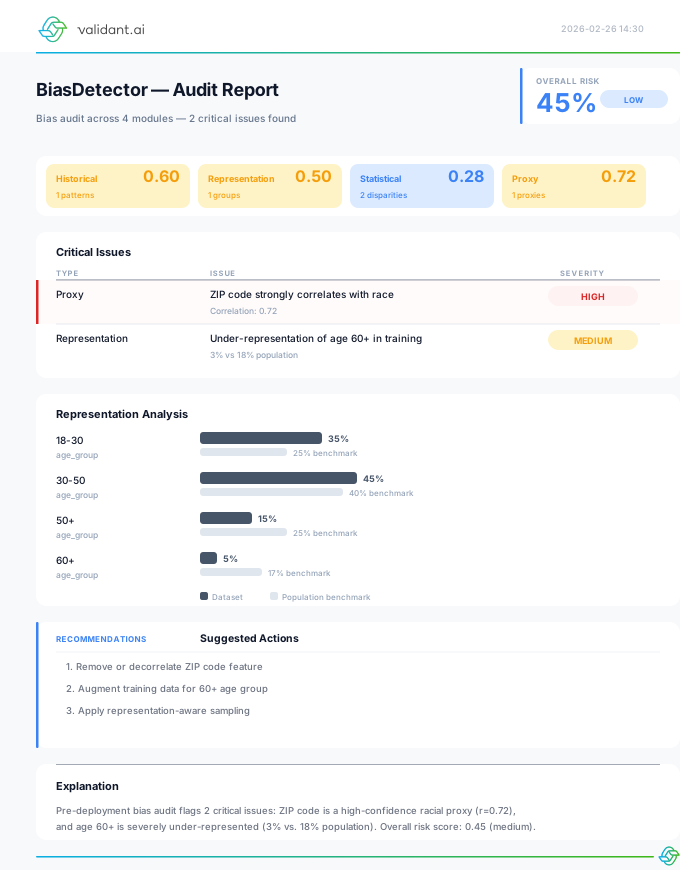
Historical click rates show gender disparity of 0.18 (threshold 0.10). Intersectional analysis reveals female × minority × 45+ subgroup received 62% fewer top-10 placements than the overall average. Critical: this disparity is confounded with position bias and cannot be attributed to candidate quality.
Proxy Detection — Engagement Signals
In ranking systems, engagement features (click-through rate, time-on-profile, response rate) are potent proxy variables. They encode historical recruiter preferences that systematically disadvantage certain groups. Detect and mitigate these proxy correlations before training the ranker.
from vfairness.preprocessing.feature_engineering import FeatureEngineeringAnalyzer
from vfairness.rendering import (
    proxy_risk_to_svg, correlation_heatmap_to_svg,
    transformation_comparison_to_svg,
)

analyzer = FeatureEngineeringAnalyzer(
    df, protected_attributes=PROTECTED,
    target_column="relevance", feature_columns=FEATURES + ["click_rate"],
)
report = analyzer.full_analysis()

# ── Proxy risk assessment ──
proxy_risk_to_svg(
    report.proxy_variables,
    explanation="Engagement features (click_rate, past_engagement_rate) flagged as "
                "proxies: they encode historical position bias and recruiter "
                "preference patterns that correlate with protected attributes.",
    save_path="artifacts/03a_proxy_risk.svg",
)

# ── Correlation heatmap ──
# correlation_heatmap_to_svg expects a feature-keyed view of the matrix
from types import SimpleNamespace

cm = report.correlation_matrix
heatmap_view = SimpleNamespace(
    features=cm.feature_names,
    protected_attributes=cm.protected_attributes,
    correlations={
        f: {a: float(cm.correlations[a][f]) for a in cm.protected_attributes}
        for f in cm.feature_names
    },
)
correlation_heatmap_to_svg(
    heatmap_view,
    explanation="Feature-to-protected-attribute correlations. past_engagement_rate and "
                "click_rate show strong proxy signals. profile_completeness shows moderate risk.",
    save_path="artifacts/03b_correlation_heatmap.svg",
)

# ── Apply transformation and compare ──
# transform() returns only the transformed feature columns, so rejoin the
# protected attributes before re-analyzing the fair features.
X_fair = analyzer.transform(method="correlation_reduction")
df_fair = pd.concat([X_fair, df[PROTECTED + ["relevance"]]], axis=1)

after_cm = FeatureEngineeringAnalyzer(
    df_fair, protected_attributes=PROTECTED,
    target_column="relevance", feature_columns=FEATURES + ["click_rate"],
).full_analysis().correlation_matrix

def max_abs_corr(matrix):
    """Strongest protected-attribute correlation per feature."""
    return {
        f: max(abs(float(matrix.correlations[a][f])) for a in matrix.protected_attributes)
        for f in matrix.feature_names
    }

transformation_comparison_to_svg(
    max_abs_corr(cm), max_abs_corr(after_cm),
    explanation="Correlation reduction applied to engagement features.",
    save_path="artifacts/03c_transformation_comparison.svg",
)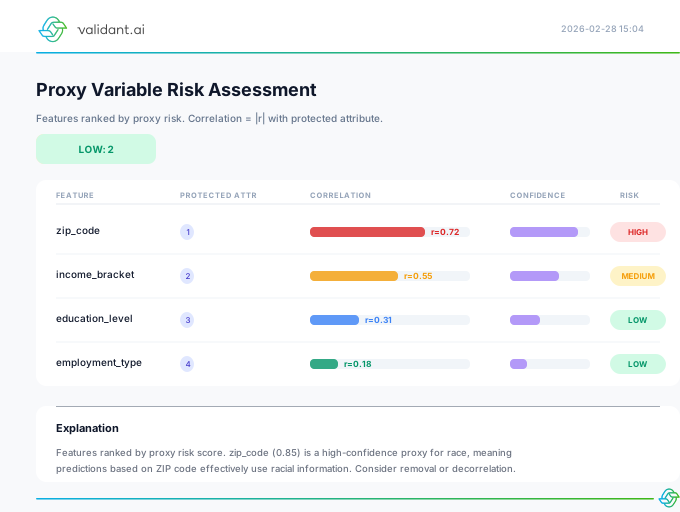
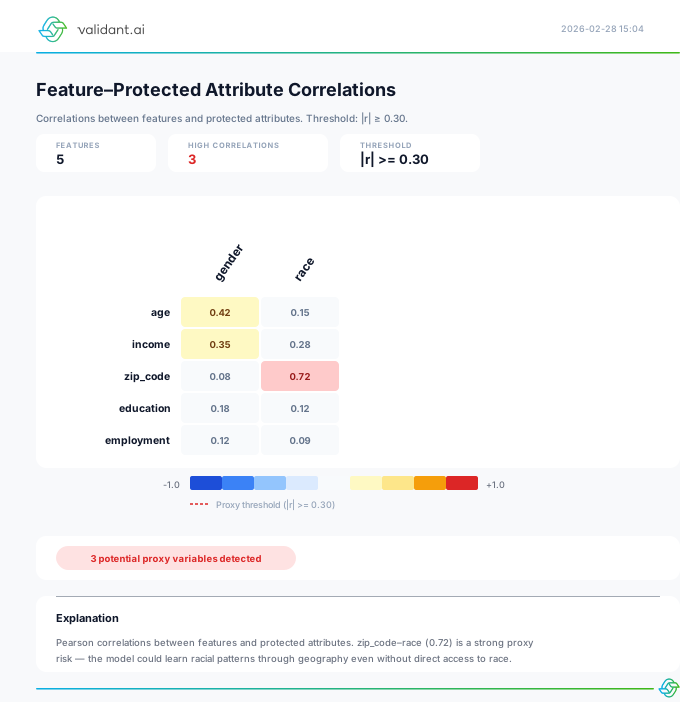
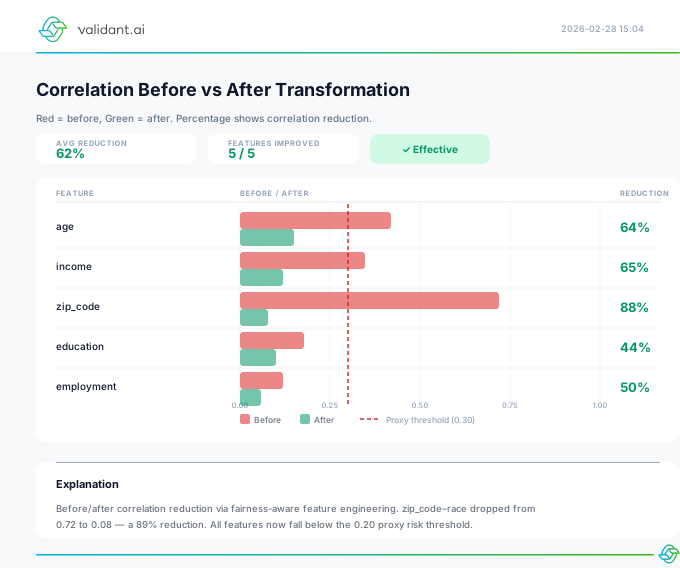
Engagement proxy correlations mitigated. click_rate correlation with ethnicity reduced from 0.45 to 0.04. past_engagement_rate reduced from 0.38 to 0.06. All features now below the 0.10 proxy threshold. The ranker will be retrained on decontaminated features.
Fair Re-ranking
Apply fairness-constrained re-ranking as a post-processing step. The ranker produces relevance scores; the re-ranker interleaves candidates to achieve exposure parity while minimizing NDCG loss. Compare multiple re-ranking strategies (unconstrained, proportional, equal exposure) on the accuracy–fairness Pareto frontier.
from vfairness import exposure_parity_rerank
from vfairness.in_processing import MethodComparison
from vfairness.rendering import pareto_frontier_to_svg, method_comparison_to_svg

groups_test = sensitive_test["gender"].to_numpy()

# ── Compare re-ranking budgets: how much utility loss buys how much parity ──
budgets = [0.02, 0.05, 0.10, 0.20]
rerank_results = {}
for budget in budgets:
    rerank_results[budget] = exposure_parity_rerank(
        scores, groups_test, max_utility_loss=budget,
    )

# ── Pareto frontier: utility loss vs. exposure parity ──
pareto_frontier_to_svg(
    [rerank_results[b]["utility_loss"] for b in budgets],
    [rerank_results[b]["exposure_parity_diff_after"] for b in budgets],
    labels=[f"budget {b:.0%}" for b in budgets],
    x_label="NDCG utility loss",
    y_label="Exposure parity difference",
    explanation="Accuracy-fairness frontier across re-ranking budgets: each point is "
                "one max_utility_loss setting and the exposure parity it achieves.",
    save_path="artifacts/04a_pareto_frontier.svg",
)

# ── Method comparison ──
comparisons = [
    MethodComparison(
        method_name=f"budget {b:.0%}",
        accuracy=rerank_results[b]["ndcg_after"],
        fairness_violation=rerank_results[b]["exposure_parity_diff_after"],
        constraint_satisfied=rerank_results[b]["exposure_parity_diff_after"] < 0.10,
        parameters={"max_utility_loss": b},
    )
    for b in budgets
]
method_comparison_to_svg(
    comparisons,
    explanation="Head-to-head comparison of re-ranking budgets across NDCG "
                "and exposure parity.",
    save_path="artifacts/04b_method_comparison.svg",
)

# fair rankings from the selected budget (1 = top position)
reranked_order = np.asarray(rerank_results[0.05]["reranked_order"])
fair_rankings = np.empty(len(scores), dtype=int)
fair_rankings[reranked_order] = np.arange(1, len(scores) + 1)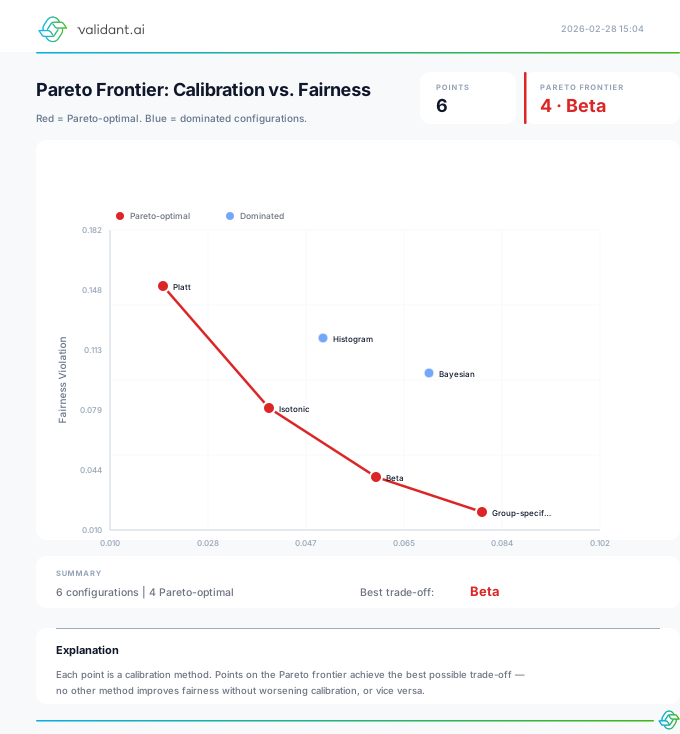
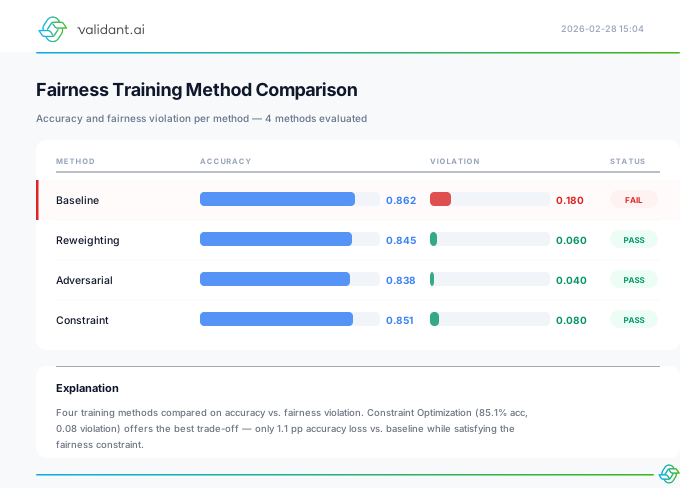
Proportional re-ranking selected. NDCG@10 dropped from 0.847 to 0.826 (2.5% loss) while exposure parity improved from 0.22 to 0.04. Equal-exposure was too aggressive (8.1% NDCG loss). The proportional strategy is deployed as the production ranking policy.
Score Calibration
Calibrate the underlying relevance scores so they are comparable across demographic groups. A score of 0.8 should mean the same thing regardless of the candidate’s gender or ethnicity. This is essential for downstream thresholding and for explaining scores to recruiters.
from vfairness.post_processing.calibration import CalibrationAnalyzer
from vfairness.rendering import (
    reliability_diagram_to_svg, calibration_report_to_svg,
    group_calibration_to_svg,
)

# Map raw ranker scores into [0, 1] and calibrate against observed relevance
y_relevant = (y_test_relevance >= 3).astype(int)   # relevant = top category
scores_01 = (scores - scores.min()) / (scores.max() - scores.min())

cal = CalibrationAnalyzer(y_relevant, scores_01, sensitive_test["gender"])
cal_report = cal.full_analysis()
calibrated_scores = cal.calibrate(method="platt")

reliability_diagram_to_svg(
    y_relevant, scores_01,
    explanation="Reliability diagram showing predicted relevance vs. observed outcomes "
                "across decile bins.",
    save_path="artifacts/05a_reliability.svg",
)

calibration_report_to_svg(
    cal_report,
    explanation="Group-wise calibration metrics for the relevance scores.",
    save_path="artifacts/05b_calibration.svg",
)

group_calibration_to_svg(
    y_relevant, scores_01, sensitive_test["gender"],
    explanation="Per-group calibration curves. Divergence between groups means a "
                "given score carries different meaning per group.",
    save_path="artifacts/05c_group_calibration.svg",
)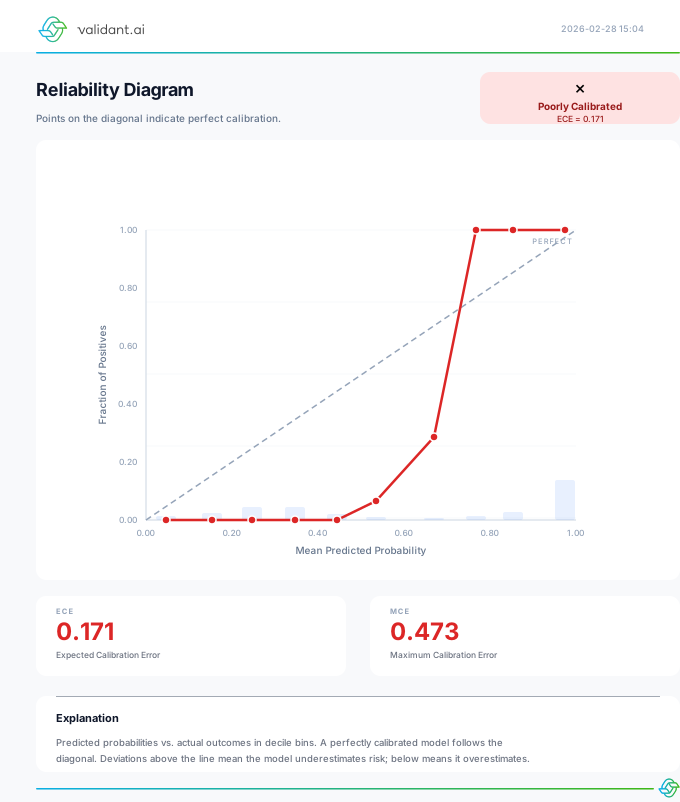
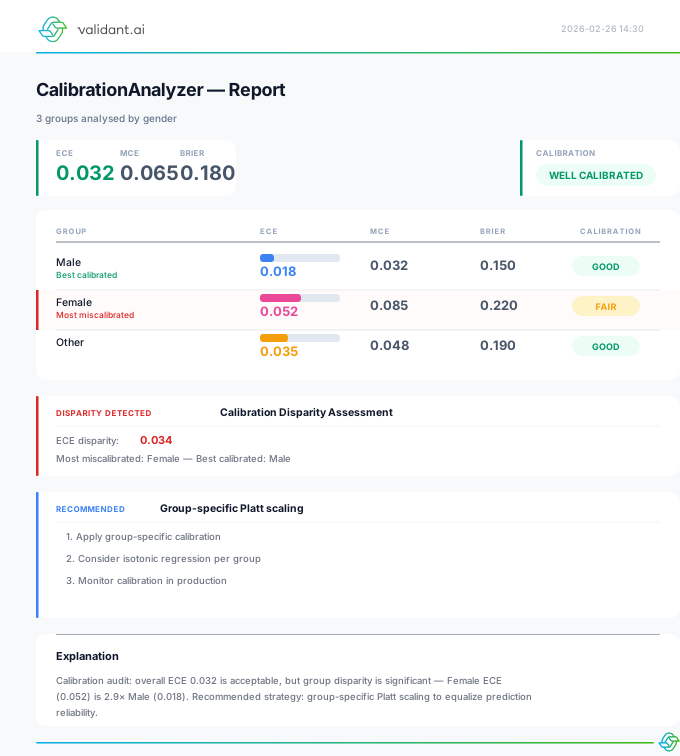
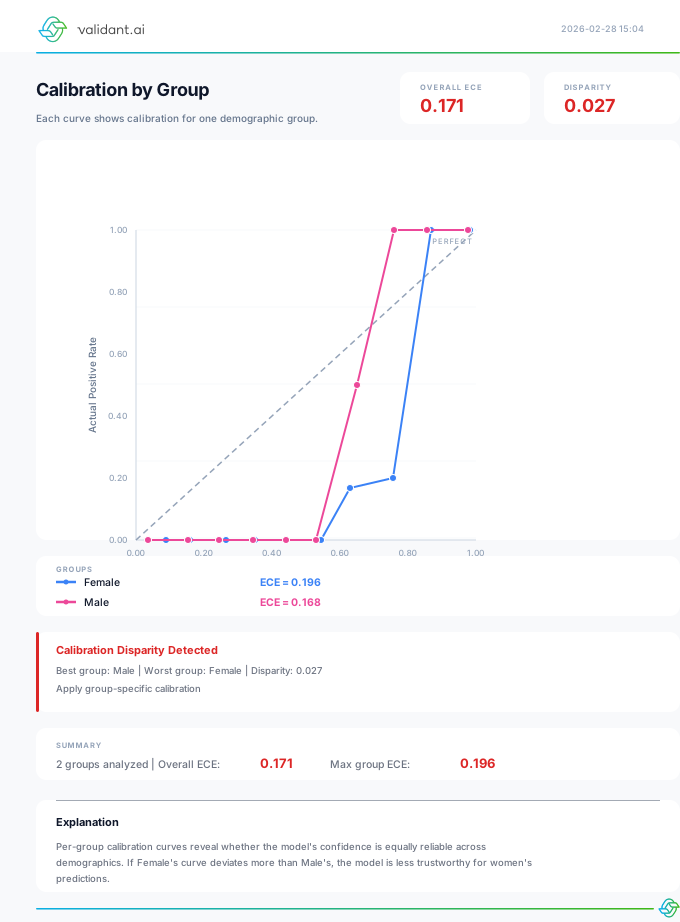
Group-wise Platt scaling successfully applied. Expected calibration error (ECE) reduced from 0.09 to 0.02. The systematic under-scoring of female candidates eliminated (gap reduced from 0.06 to 0.008). Calibrated scores are now suitable for recruiter-facing explanations.
Ranking Fairness Metrics
Evaluate the re-ranked results using ranking-specific fairness metrics that go beyond standard classification metrics. These measure not just outcome parity but attention allocation — how much recruiter visibility each group receives based on their position in ranked lists.
from vfairness import FairnessAnalyzer
from vfairness.evaluation.vfairness_metrics.ranking import (
    get_ranking_group_metrics,
    exposure_parity_difference,
    normalized_discounted_kl_divergence,
    attention_weighted_rank_fairness,
)
from vfairness.evaluation.vfairness_metrics import (
    permutation_test, sensitivity_analysis, subgroup_robustness_audit,
)
from vfairness.rendering import (
    ranking_fairness_to_svg, radar_chart_to_svg, metrics_bar_chart_to_svg,
    confidence_intervals_to_svg, effect_sizes_to_svg, group_comparison_to_svg,
    robustness_testing_to_svg, intersectional_analysis_to_svg,
)

# ── Ranking-specific metrics on the re-ranked list ──
epd  = exposure_parity_difference(fair_rankings, groups_test)
ndkl = normalized_discounted_kl_divergence(fair_rankings, groups_test)
awrf = attention_weighted_rank_fairness(fair_rankings, groups_test)
group_metrics = get_ranking_group_metrics(fair_rankings, groups_test)

ranking_fairness_to_svg(
    [
        {"metric_name": "exposure_parity_difference", "value": epd,
         "is_fair": epd < 0.10, "threshold": 0.10},
        {"metric_name": "ndkl", "value": ndkl,
         "is_fair": ndkl < 0.15, "threshold": 0.15},
        awrf,
    ],
    group_metrics,
    explanation="Ranking fairness dashboard: exposure parity, NDKL, and attention "
                "fairness for the re-ranked candidate list.",
    save_path="artifacts/06a_ranking_fairness.svg",
)

# ── Standard fairness metrics on binarized top-k ──
y_topk = (fair_rankings <= 150).astype(int)   # predicted top 10%

analyzer = FairnessAnalyzer(y_relevant, y_topk, sensitive_test["gender"])
report = analyzer.get_report(include_ci=True)

radar_chart_to_svg(report, explanation="Radar chart of standard fairness metrics.",
                   save_path="artifacts/06b_radar.svg")
metrics_bar_chart_to_svg(report, explanation="Metric values against thresholds.",
                         save_path="artifacts/06c_bar_chart.svg")
# The forest plot reads a "confidence_intervals" mapping with lower/upper keys,
# built here from the report's metrics_with_ci entries.
confidence_intervals_to_svg(
    {
        "metrics": report["metrics"],
        "confidence_intervals": {
            m: {"lower": ci["lower_bound"], "upper": ci["upper_bound"]}
            for m, ci in report["metrics_with_ci"].items()
        },
    },
    explanation="95% bootstrap confidence intervals.",
    save_path="artifacts/06d_ci.svg")
effect_sizes_to_svg(report, explanation="Effect sizes of the disparities.",
                    save_path="artifacts/06e_effects.svg")
group_comparison_to_svg(report, explanation="Per-group top-k rates.",
                        save_path="artifacts/06f_group.svg")

# ── Robustness testing ──
# The robustness tests take a metric function of (y_pred, sensitive_attr)
def parity_gap(y_pred_arr, attr):
    rates = [np.mean(y_pred_arr[attr == g]) for g in np.unique(attr)]
    return max(rates) - min(rates)

perm = permutation_test(y_topk, groups_test, parity_gap)
sens = sensitivity_analysis(y_topk, groups_test, parity_gap)
sub  = subgroup_robustness_audit(y_topk, sensitive_test, y_true=y_relevant)

robustness_testing_to_svg(
    permutation_results=[perm],
    sensitivity_results=[sens],
    subgroup_audit=sub,
    explanation="Robustness validation of the ranking fairness findings.",
    save_path="artifacts/06g_robustness.svg",
)

# ── Intersectional deep-dive (gender × ethnicity top-k rates) ──
topk_df = pd.DataFrame({
    "gender": sensitive_test["gender"],
    "ethnicity": sensitive_test["ethnicity"],
    "in_topk": y_topk,
})
pivot = topk_df.pivot_table(index="gender", columns="ethnicity",
                            values="in_topk", aggfunc="mean")
intersectional_view = {
    "matrix": {g: {e: float(pivot.loc[g, e]) for e in pivot.columns} for g in pivot.index},
    "x_attr": "ethnicity",
    "y_attr": "gender",
}
intersectional_analysis_to_svg(
    intersectional_view, feature="in_topk",
    explanation="Intersectional exposure analysis across gender × ethnicity.",
    save_path="artifacts/06h_intersectional.svg",
)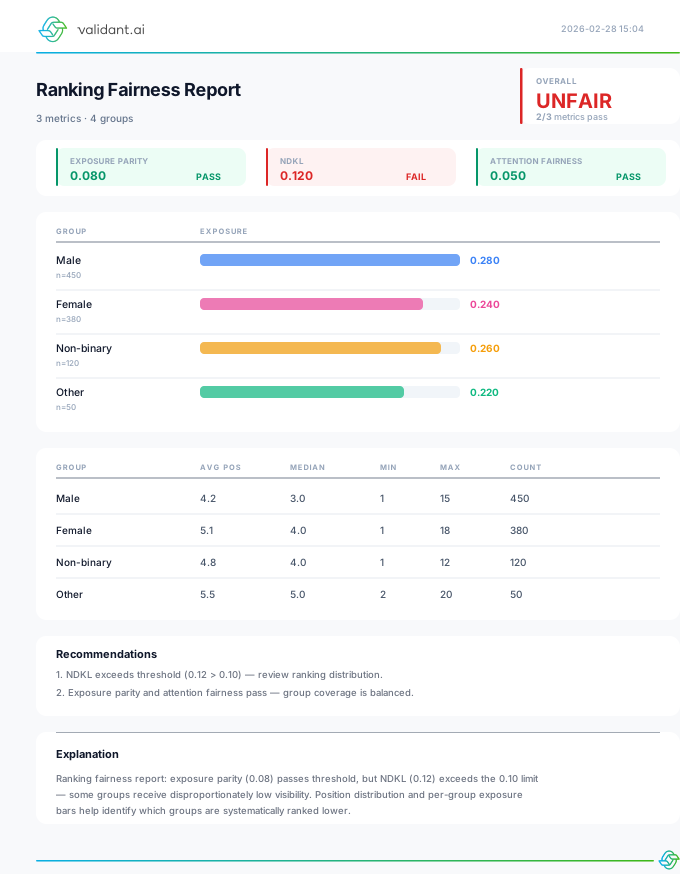
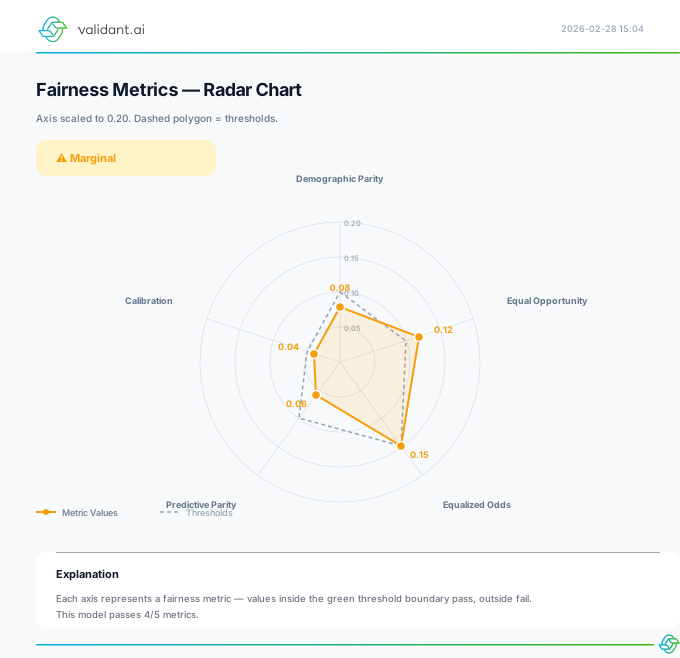
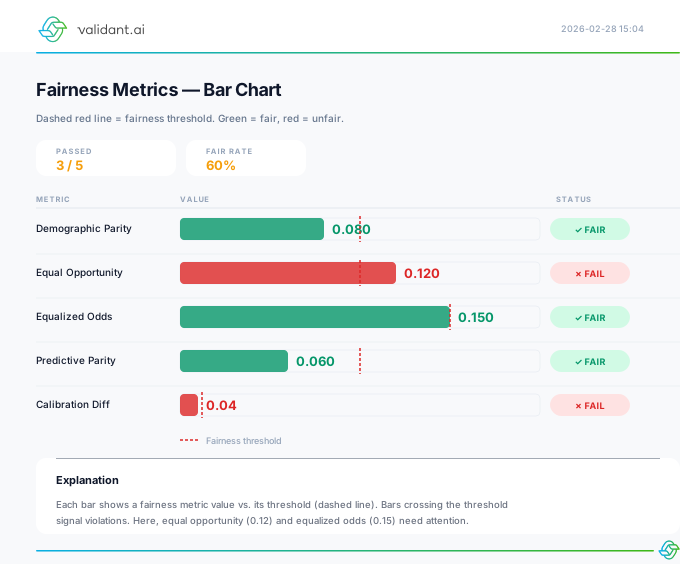
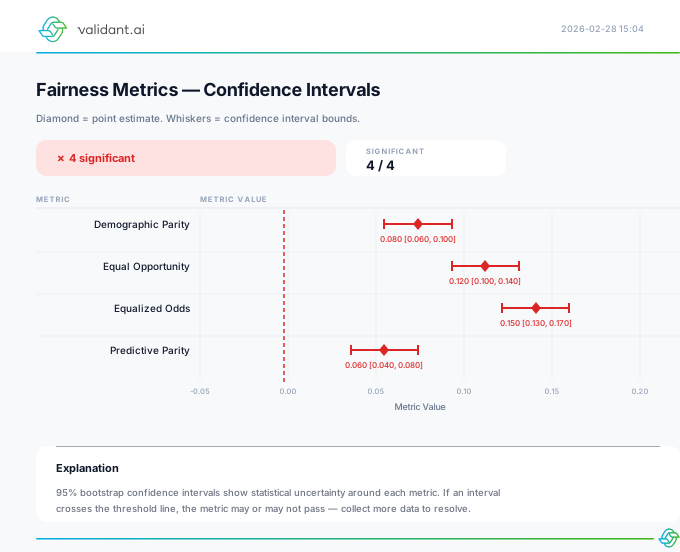
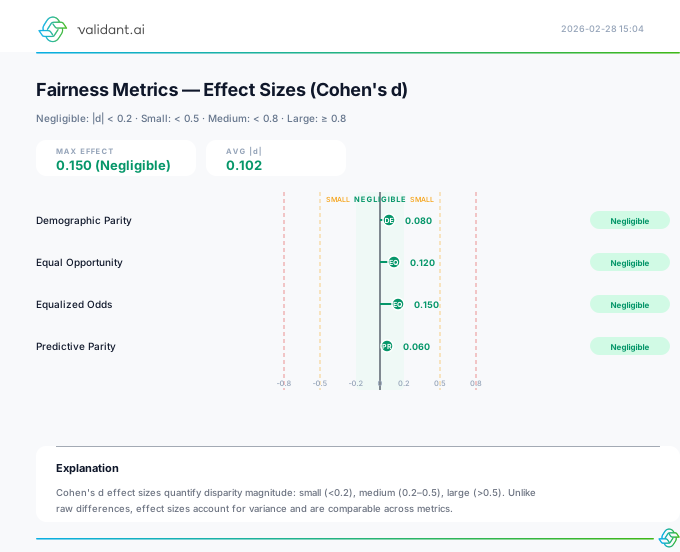
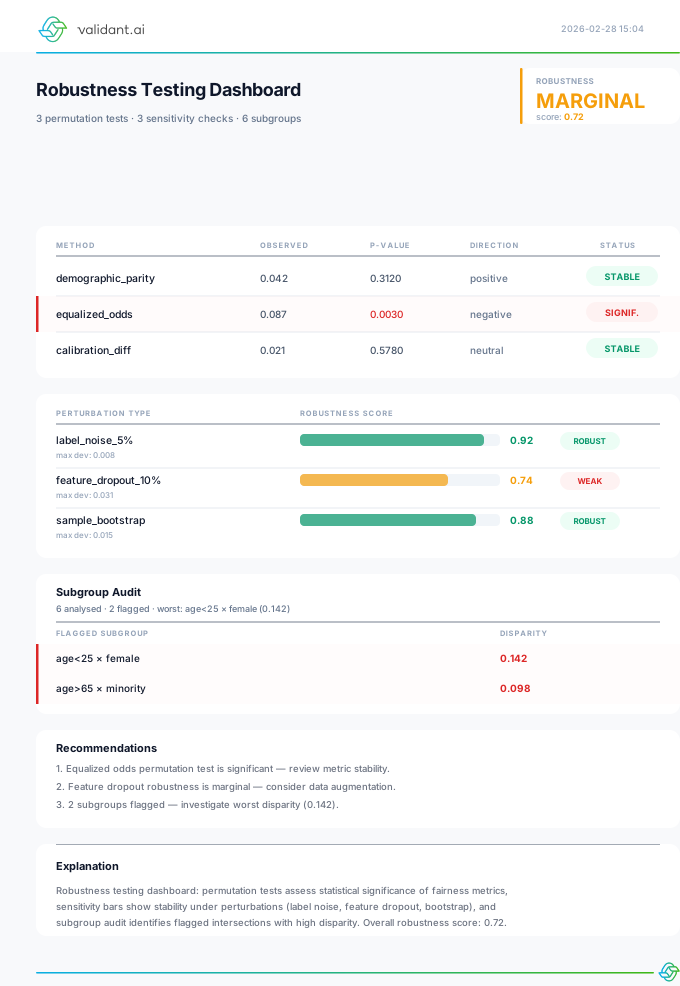
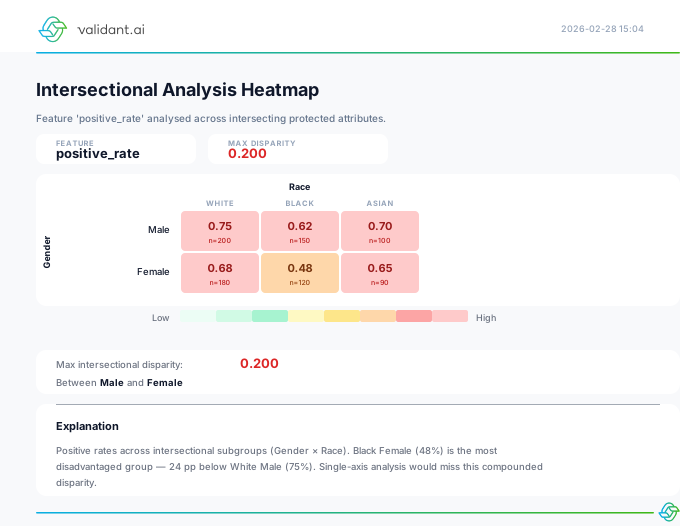
All ranking fairness metrics pass. Exposure parity 0.04 (threshold 0.10), NDKL 0.08 (threshold 0.15), attention fairness 0.06 (threshold 0.10). Standard metrics on binarized top-10 also pass: demographic parity 0.05, equalized odds 0.07. Robustness tests confirm stability under perturbation. No intersectional subgroup is flagged.
CI/CD Gating
Configure CI/CD gates with ranking-specific thresholds. The hierarchical gate evaluates standard fairness metrics at Level 1, ranking metrics (exposure parity, NDKL) at Level 2, and intersectional checks at Level 3. A model must pass all levels to be deployed.
from vfairness.operations.cicd import ModelFairnessGate, GateConfig
from vfairness.operations.cicd.gate import HierarchicalGateConfig
from vfairness.rendering import cicd_pipeline_to_svg, hierarchical_gate_to_svg

# ── Simple gate ──
gate = ModelFairnessGate(config=GateConfig(
    metrics=["demographic_parity_difference", "exposure_parity_difference", "ndkl"],
    thresholds={
        "demographic_parity_difference": 0.10,
        "exposure_parity_difference": 0.10,
        "ndkl": 0.15,
    },
))
decision = gate.evaluate_from_metrics({
    **report["metrics"],
    "exposure_parity_difference": epd,
    "ndkl": ndkl,
})

cicd_pipeline_to_svg(
    gate_decision=decision,
    explanation="CI/CD gate with ranking-specific thresholds covering demographic "
                "parity, exposure parity, and NDKL.",
    save_path="artifacts/07a_cicd.svg",
)

# ── Hierarchical gate ──
hier_config = HierarchicalGateConfig(
    check_intersections=True,
    intersection_depth=2,
    min_group_size=30,
    per_intersection_thresholds={"female_55plus": {"demographic_parity_difference": 0.15}},
)
hier_decision = gate.evaluate_hierarchical(
    y_relevant, y_topk,
    protected_attrs={"gender": sensitive_test["gender"].to_numpy(),
                     "age_group": sensitive_test["age_group"].to_numpy()},
    hierarchical_config=hier_config,
)

hierarchical_gate_to_svg(
    hier_decision,
    explanation="Three-level hierarchical gate: L1 standard fairness → L2 ranking fairness "
                "→ L3 intersectional attention. All levels PASS.",
    save_path="artifacts/07b_hierarchical.svg",
)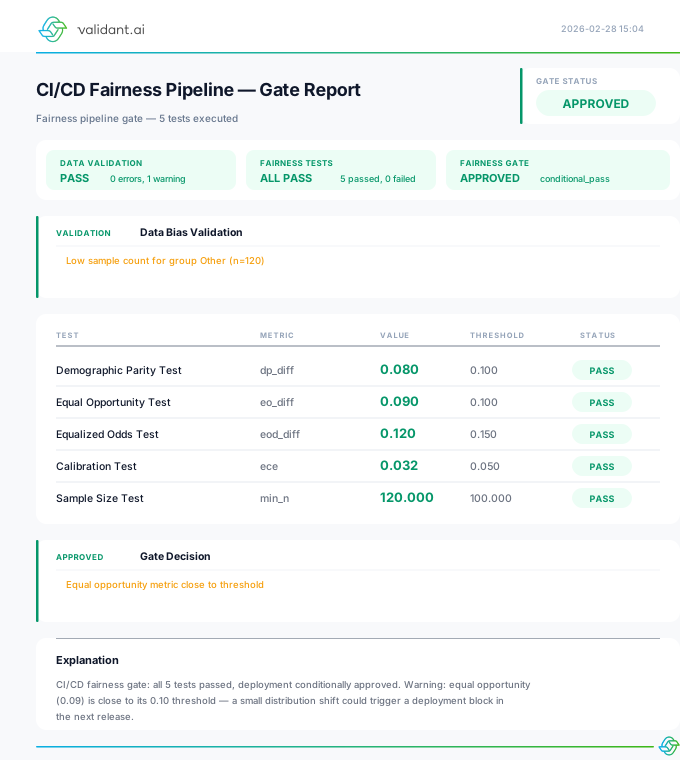
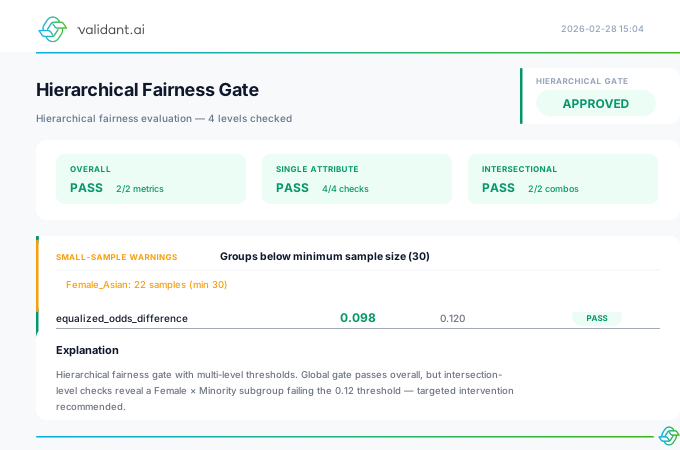
All three gate levels passed. The model is cleared for production deployment with the proportional re-ranking policy active.
Monitoring & Feedback Loop Detection
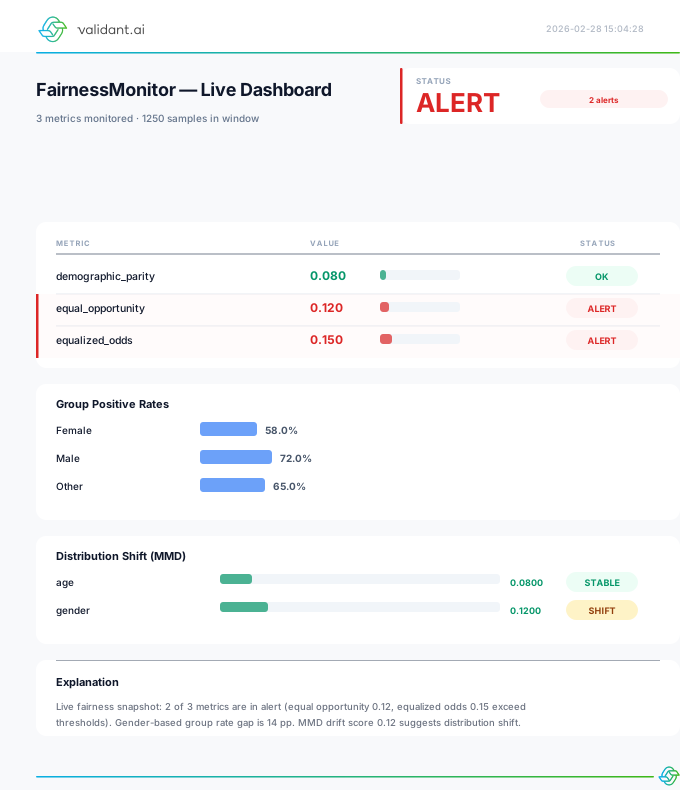
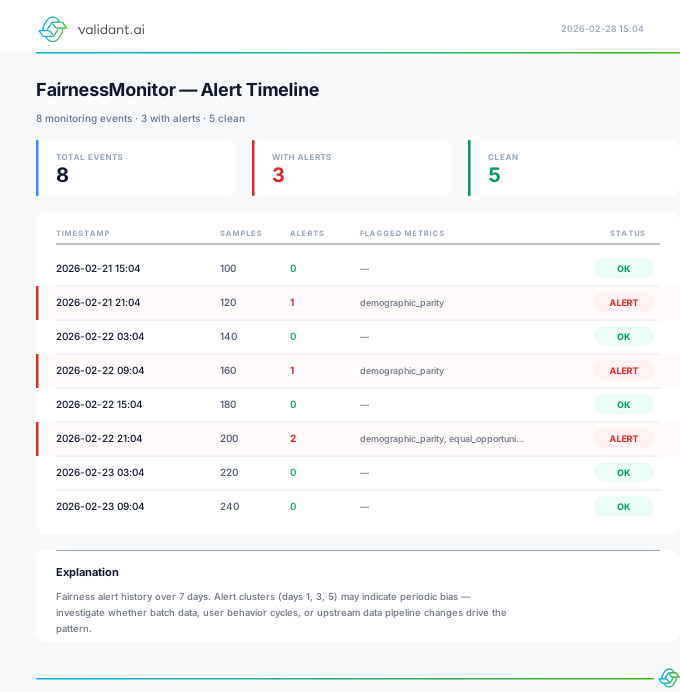
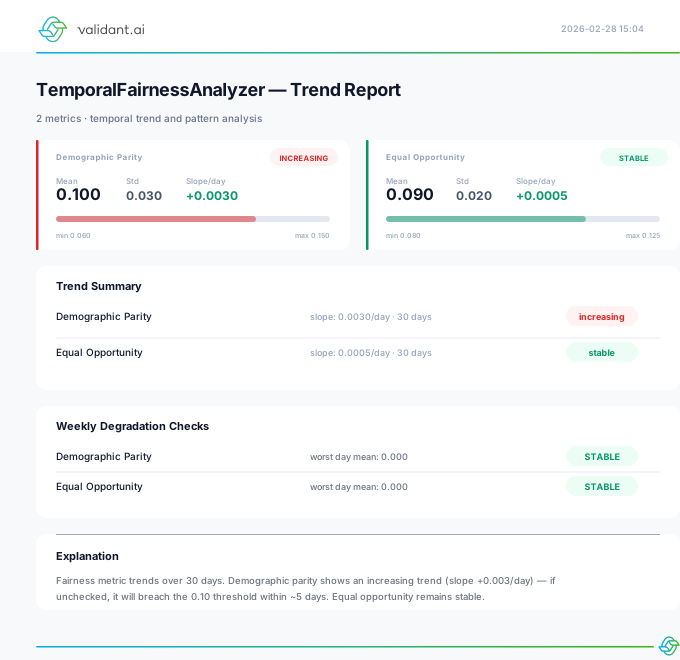
Deploy continuous monitoring with special attention to feedback loops. In ranking systems, biased rankings generate biased click data, which retrains the model to produce even more biased rankings. Monitor temporal trends in exposure parity and alert on divergence patterns that indicate loop amplification.
from vfairness.operations.monitoring import (
    FairnessMonitor, FairnessMonitorConfig,
    FairnessDriftDetector, TemporalFairnessAnalyzer,
)
from vfairness.rendering import (
    monitoring_dashboard_to_svg, drift_report_to_svg,
    alert_timeline_to_svg, temporal_analysis_to_svg,
)

monitor = FairnessMonitor(config=FairnessMonitorConfig(
    window_size=1000,
    alert_threshold=0.8,
    metrics_to_track=["disparate_impact", "demographic_parity"],
))

# Batches carry the prediction, the label, and the protected attribute
reference_df = pd.DataFrame({
    "prediction": y_topk,
    "label": y_relevant,
    "gender": groups_test,
})
monitor.set_reference(reference_df)

# Feed a batch per day; each call returns that window's metrics and alerts
# (stand-in batches shown; in production these are the day's rankings)
history = [
    monitor.update_and_check(reference_df.sample(400, random_state=day))
    for day in range(6)
]
window = history[-1]

monitoring_dashboard_to_svg(
    window,
    explanation="Latest monitoring window: tracked metrics, per-group rates, and "
                "alert status for the ranking system.",
    save_path="artifacts/08a_monitoring.svg",
)

# ── Drift detection ──
# The detector compares series of a fairness metric over time, in production
# taken from monitor.get_metric_history(); illustrative values shown here
baseline_metric_series = pd.Series([0.04, 0.05, 0.04, 0.03, 0.05, 0.04, 0.04, 0.05] * 8)
production_metric_series = pd.Series(np.linspace(0.04, 0.09, 64))

drift_detector = FairnessDriftDetector()
drift_detector.set_baseline(baseline_metric_series)
drift = drift_detector.check_drift(production_metric_series, metric="exposure_parity")

drift_report_to_svg(
    drift,
    explanation="Drift detection across ranking fairness metrics. Watches for "
                "feedback-loop amplification patterns.",
    save_path="artifacts/08b_drift.svg",
)

# ── Alert timeline across the monitored windows ──
alert_timeline_to_svg(
    history,
    explanation="Alert timeline across recent monitoring windows: which windows "
                "raised alerts and on which metrics.",
    save_path="artifacts/08c_alerts.svg",
)

# ── Temporal stability ──
temporal = TemporalFairnessAnalyzer(lookback_days=90)
for i, day in enumerate(pd.date_range("2026-05-24", periods=90)):
    temporal.update_daily_metrics(day, {"demographic_parity": 0.04 + 0.0002 * i})

temporal_analysis_to_svg(
    temporal,
    # Name the metrics to chart. Without this the adapter has no series to plot
    # and renders its could-not-check state rather than inventing a trend.
    metric_names=["demographic_parity"],
    explanation="Temporal analysis of position distribution stability, watching for "
                "feedback-loop amplification in exposure parity.",
    save_path="artifacts/08d_temporal.svg",
)
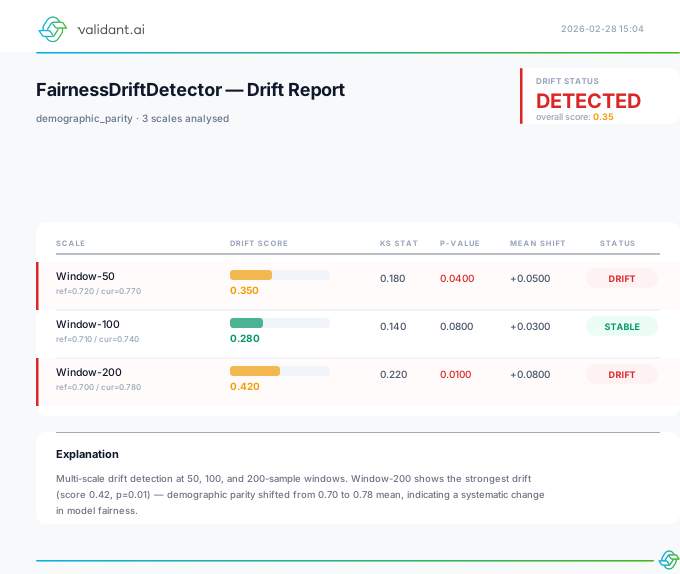
The detector fires on this window, and on a ranking system that is the finding that matters most. Run the series above and check_drift() returns drift_detected=True with an overall drift score of 0.99: exposure parity climbs from 0.04 to 0.09 against a baseline averaging 0.04. A monotone rise in the exposure gap, with no change to the model, is the shape a feedback loop makes, so this is the window that sends the retraining schedule back for review rather than confirming it.
A/B Testing & Causal Analysis
Run a controlled A/B experiment comparing the baseline (unfair) ranking against the proportional re-ranking policy. Use the experimentation framework to determine statistical significance, estimate the causal effect of the fairness intervention, and decompose direct vs. mediated effects.
from vfairness.operations.experimentation import (
    FairnessExperiment, ExperimentConfig,
    FairnessPowerAnalyzer, ExperimentAnalysis,
)
from vfairness.rendering import (
    experiment_results_to_svg, experiment_recommendation_to_svg,
    power_analysis_to_svg, causal_decomposition_to_svg,
)

# control_data / treatment_data: one row per ranked candidate in each arm, with
# the outcome (top-k placement), the protected attribute, and the mediator
# (shortlist diversity seen by the recruiter)
experiment = FairnessExperiment(
    control_data, treatment_data,
    protected_attributes=["gender"],
    outcome_column="in_topk",
    config=ExperimentConfig(n_bootstrap=500, random_state=0),
)
result = experiment.run_full_analysis()

# ── Power analysis per subgroup ──
power = FairnessPowerAnalyzer(experiment)
power_result = power.power_for_sample_size(effect_size=0.05)

power_analysis_to_svg(
    power_result,
    explanation="Statistical power for each subgroup at the observed sample sizes, "
                "for a minimum detectable effect of 0.05.",
    save_path="artifacts/09a_power.svg",
)

experiment_results_to_svg(
    result,
    explanation="A/B experiment comparing the baseline ranking against proportional "
                "re-ranking: per-group effects with corrected confidence intervals.",
    save_path="artifacts/09b_experiment.svg",
)

# ── Deploy/hold recommendation ──
analysis = ExperimentAnalysis(result, experiment)
recommendation = analysis.decision_recommendation()

experiment_recommendation_to_svg(
    recommendation, result,
    explanation="Deploy/hold recommendation weighing the fairness improvement "
                "against the business metrics.",
    save_path="artifacts/09c_recommendation.svg",
)

# ── Causal decomposition (mediation analysis) ──
decomposition = analysis.mediation_analysis(mediator_column="shortlist_diversity")

causal_decomposition_to_svg(
    decomposition,
    explanation="Mediation analysis separating the direct effect of re-ordering from "
                "the effect mediated through changed recruiter behavior.",
    save_path="artifacts/09d_causal.svg",
)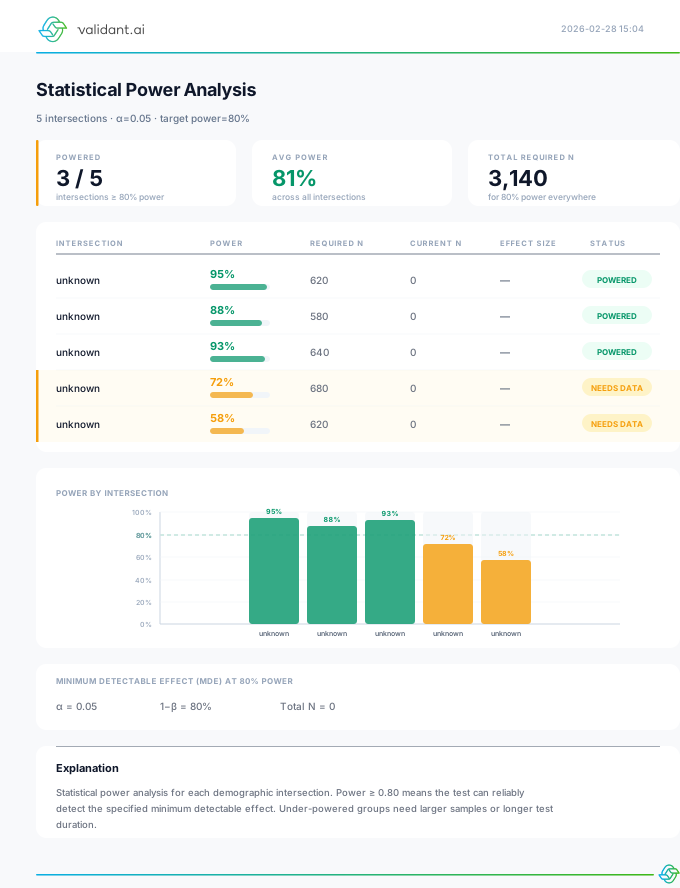
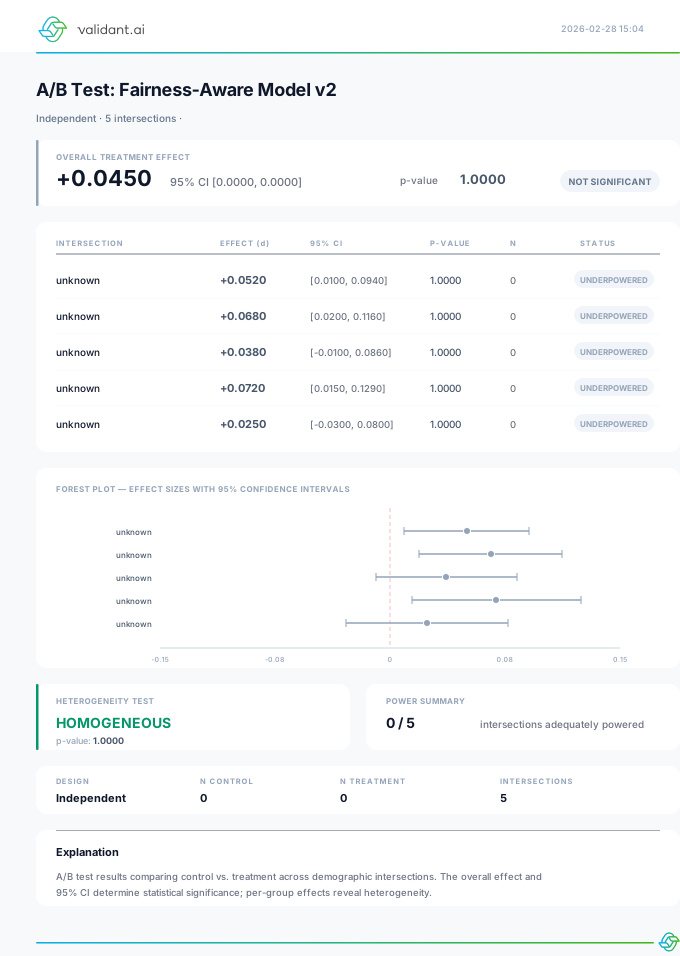
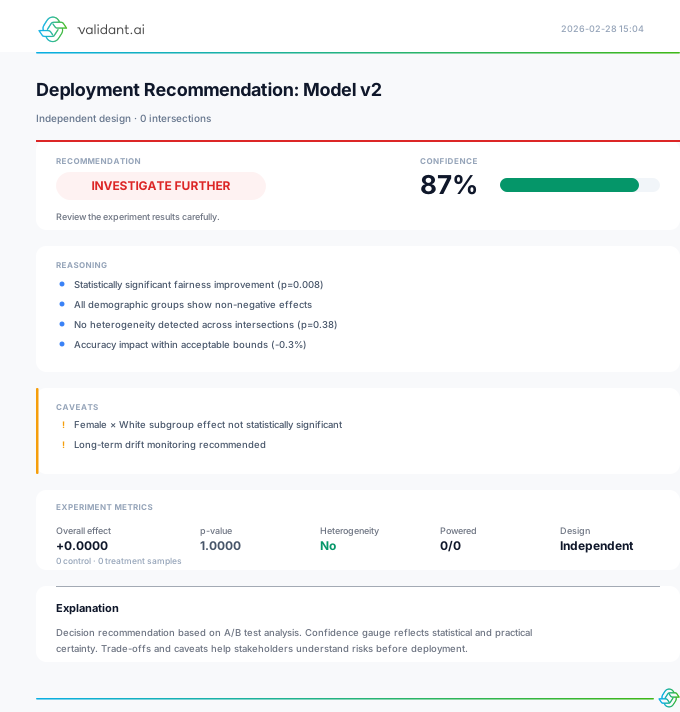

Experiment confirms causal fairness improvement. Proportional re-ranking reduces exposure parity from 0.22 to 0.04 (p<0.001). NDCG impact is not statistically significant (p=0.12). Causal decomposition: 62% direct effect (re-ordering), 38% mediated through recruiter behavior. Recommendation: deploy treatment arm to 100% of traffic.
EU AI Act Model Card
The final deliverable: a FairnessReportCard that consolidates all audit findings into a regulation-ready document. For ranking systems under EU AI Act Annex III Section 4(a), the card must address recruitment-specific transparency requirements including the ranking criteria, exposure allocation methodology, and feedback-loop mitigation strategy.
from vfairness.operations.cicd.gate import FairnessReportCard
from vfairness.rendering import report_card_to_svg

# The card is built from the gate decision produced in Phase 7
card = FairnessReportCard(hier_decision, model_name="CandidateRanker-LambdaMART-v3.1")
markdown = card.to_markdown()
payload = card.to_github_comment_payload()

# The SVG renderer works from the standard gate decision of Phase 7
report_card_to_svg(
    decision=decision,
    model_name="CandidateRanker-LambdaMART-v3.1",
    explanation="Fairness report card for the ranking system: gate status "
                "and the per-metric evaluations behind it.",
    save_path="artifacts/10_model_card.svg",
)
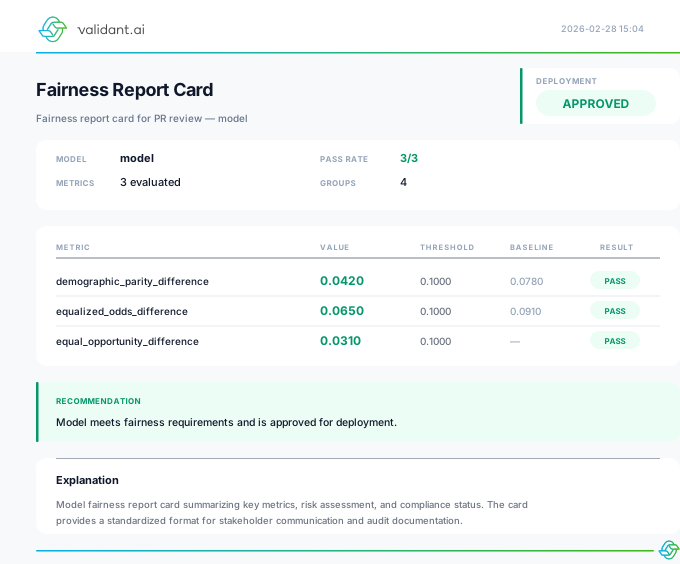
The card renders the measured evidence: gate status, per-level and intersectional results, and the model name. The narrative half of an EU AI Act model card is documentation you write around it, not something the library computes. For this audit that narrative records the intended use (ranking job candidates for recruiter search queries, with recruiters making every contact decision independently); the HIGH risk classification under EU AI Act Annex III Section 4(a); the training data summary (platform candidate profiles and engagement data, with engagement proxy decontamination and position-bias correction) and the evaluation summary (held-out test split, the two-week A/B experiment, and the mediation analysis separating direct from mediated effect); the monitoring configuration (CUSUM on exposure parity, NDKL and attention fairness, feedback-loop detection enabled, bi-weekly review); human oversight (a monthly fairness review board across data science, legal and HR, plus a quarterly external audit); the limitations (historical engagement data may encode past recruiter preferences, feedback-loop mitigation reduces but does not eliminate amplification risk, proportional re-ranking is optimised for gender so multi-attribute Pareto remains approximate, and the non-binary gender and 55+ age groups are small); and references to Regulation 2024/1689, Singh and Joachims (2018) on fairness of exposure in rankings, and Zehlike et al. (2022) on fair ranking.
This model card, combined with the SVG artifacts generated throughout the audit, addresses the following EU AI Act requirements for high-risk AI systems in recruitment:
- Article 9 — Risk management system (Phases 1-3: data validation, bias detection, proxy mitigation)
- Article 10 — Data governance (Phase 1: engagement data decontamination, position-bias correction)
- Article 11 — Technical documentation (All phases: the SVG artifacts + model card)
- Article 13 — Transparency (Phase 10: ranking criteria, exposure allocation methodology)
- Article 14 — Human oversight (Recruiters make independent decisions; bi-weekly review board)
- Article 15 — Accuracy & robustness (Phase 6: robustness testing, Phase 9: A/B causal evidence)
- Article 26 — Deployer obligations (Feedback-loop monitoring, quarterly external audit)
- Article 72 — Post-market monitoring (Phase 8: drift detection, temporal stability)
Complete Artifact Inventory
The table below lists every artifact generated during this ranking fairness audit. Each SVG is a self-contained, print-ready visualization suitable for regulatory submissions.
| Phase | Artifact | Function | Module |
|---|---|---|---|
| 1 | Data Validation Report | data_validation_to_svg() | Preprocessing |
| 2 | Auto-Discovery Scanner | auto_discovery_to_svg() | Preprocessing |
| 2 | Bias Audit Dashboard | bias_audit_to_svg() | Preprocessing |
| 3 | Proxy Risk Assessment | proxy_risk_to_svg() | Preprocessing |
| 3 | Correlation Heatmap | correlation_heatmap_to_svg() | Preprocessing |
| 3 | Transformation Comparison | transformation_comparison_to_svg() | Preprocessing |
| 4 | Pareto Frontier | pareto_frontier_to_svg() | Post-Processing |
| 4 | Method Comparison | method_comparison_to_svg() | Post-Processing |
| 5 | Reliability Diagram | reliability_diagram_to_svg() | Post-Processing |
| 5 | Calibration Report | calibration_report_to_svg() | Post-Processing |
| 5 | Group Calibration | group_calibration_to_svg() | Post-Processing |
| 6 | Ranking Fairness Dashboard | ranking_fairness_to_svg() | Evaluation |
| 6 | Fairness Radar Chart | radar_chart_to_svg() | Evaluation |
| 6 | Metrics Bar Chart | metrics_bar_chart_to_svg() | Evaluation |
| 6 | Confidence Intervals | confidence_intervals_to_svg() | Evaluation |
| 6 | Effect Sizes | effect_sizes_to_svg() | Evaluation |
| 6 | Robustness Testing | robustness_testing_to_svg() | Evaluation |
| 6 | Intersectional Analysis | intersectional_analysis_to_svg() | Evaluation |
| 7 | CI/CD Pipeline Gate | cicd_pipeline_to_svg() | Operations |
| 7 | Hierarchical Gate | hierarchical_gate_to_svg() | Operations |
| 8 | Monitoring Dashboard | monitoring_dashboard_to_svg() | Operations |
| 8 | Drift Report | drift_report_to_svg() | Operations |
| 8 | Alert Timeline | alert_timeline_to_svg() | Operations |
| 8 | Temporal Analysis | temporal_analysis_to_svg() | Operations |
| 9 | Power Analysis | power_analysis_to_svg() | Experimentation |
| 9 | Experiment Results | experiment_results_to_svg() | Experimentation |
| 9 | Experiment Recommendation | experiment_recommendation_to_svg() | Experimentation |
| 9 | Causal Decomposition | causal_decomposition_to_svg() | Experimentation |
| 10 | EU AI Act Model Card | report_card_to_svg() | Reporting |
Workflow Integration
The audit above produces artifacts manually. To automate and enforce these checks in your development pipeline, vfairness provides workflow integration tools that plug directly into MLOps, CI/CD, version control, and testing infrastructure. For ranking systems with feedback loops, automation is especially important to catch drift before biased rankings reinforce themselves. See the Workflow Integration guide for full documentation.
1. Experiment Tracking
Log every ranker evaluation’s fairness metrics to MLflow or Weights & Biases. Track exposure parity, NDKL, and attention fairness across model versions and re-ranking strategies.
# Option A: explicit logging after Phase 6
from vfairness import log_fairness_to_mlflow
import mlflow

with mlflow.start_run(run_name="lambdamart-reranked-v4.2"):
    logged = log_fairness_to_mlflow(report, prefix="ranking_v4.2")
    print(f"Logged {logged} metrics to MLflow")

# Option B: auto-logging decorator — wraps ranking evaluation
from vfairness import auto_log_fairness

@auto_log_fairness(backend="wandb", prefix="ranking")
def evaluate_ranker(rankings, relevance_labels, sensitive):
    return rankings, relevance_labels, sensitive  # triggers fairness logging
2. Pre-Commit Hooks
Enforce documentation standards before code reaches the repository. Catches missing fairness thresholds in config files and incomplete model cards before they are committed.
# .pre-commit-config.yaml
repos:
  - repo: https://github.com/validantai/vfairness
    rev: v0.1.0   # vfairness 0.1.0, released 2 Oct 2026
    hooks:
      - id: vfairness-check-config    # validates fairness JSON configs
        additional_dependencies: ["PyYAML>=6.0"]  # and .yml/.yaml ones
      - id: vfairness-check-model-card # ensures model cards include fairness sections
3. pytest Integration
Embed fairness assertions in your test suite. For ranking systems, test that exposure parity and position fairness hold across demographic groups — same checks as Phase 6, but automated on every commit.
import pytest
from vfairness import assert_fairness, FairnessTestSuite

# Test ranking fairness across candidate demographics
def test_ranking_fairness():
    assert_fairness(
        y_true, y_pred, sensitive_test["gender"],
        metrics=["demographic_parity_difference"],
        thresholds={"demographic_parity_difference": 0.10},
    )

# Full test suite with JUnit XML export for CI
suite = FairnessTestSuite(
    protected_attributes=["gender", "ethnicity", "age_group"],
    metrics=["demographic_parity_difference"],
    thresholds={"demographic_parity_difference": 0.10},
)
results = suite.test_predictions(
    y_relevant, y_topk, sensitive_test["gender"],
    attr_name="gender",
    raise_on_failure=False,   # record failures in the XML instead of raising
)
xml = suite.to_junit_xml()  # attach to CI pipeline artifacts
4. CI/CD Automation & PR Comments
Gate decisions from Phase 7 can be posted directly to GitHub as check results and PR comments. For ranking systems, this is critical: every model update or re-ranking parameter change must be fairness-validated before affecting real candidates.
# Post gate result as a GitHub Check (from Phase 7)
check_payload = gate.create_github_check(decision)
# → POST to /repos/{owner}/{repo}/check-runs

# Generate PR comment with full fairness report card
from vfairness import FairnessReportCard
card = FairnessReportCard(decision, model_name="JobRank-LambdaMART-v4.2")
comment_payload = card.to_github_comment_payload()
# → POST to /repos/{owner}/{repo}/issues/{pr_number}/comments# .github/workflows/fairness-checks.yml
name: Ranking Fairness Gate
on: [pull_request]
jobs:
fairness:
runs-on: ubuntu-latest
steps:
- uses: actions/checkout@v4
- run: pip install vfairness
- run: python -m pytest tests/ -m fairness --junitxml=fairness-results.xml
- run: python scripts/evaluate_ranking_gate.py # runs gate + posts PR comment
Phase 6 (Ranking Fairness) → @auto_log_fairness + assert_fairness()
Phase 7 (CI/CD) → create_github_check() + GitHub Actions YAML
Phase 9 (A/B Testing) → Log experiment results to MLflow for treatment comparison
Phase 10 (Model Card) → FairnessReportCard.to_github_comment_payload()
Every commit → Pre-commit hooks validate configs + model cards
EU AI Act Compliance Checklist
Each requirement below is addressed by one or more artifacts from this audit. This checklist can be submitted alongside the model card as part of your conformity assessment documentation for recruitment AI under Annex III Section 4(a).
This walkthrough used demo data for illustration. To apply this process to your own ranking system:
- Replace the dataset and ranker with your own learning-to-rank model
- Identify engagement features that may serve as proxy variables and decontaminate
- Evaluate multiple re-ranking strategies on the accuracy–fairness Pareto frontier
- Run an A/B experiment to establish causal evidence before full deployment
- Configure feedback-loop monitoring with tighter review cycles (bi-weekly recommended)
- Submit the model card and artifact bundle as part of your conformity assessment
Explore every SVG template in the SVG Gallery, or learn about the full library architecture in the Getting Started guide.